
Fig. 1.
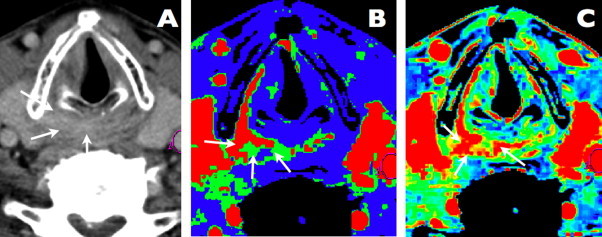
A case of hypopharyngeal squamous cell carcinoma. Axial contrast-enhanced CT scan. Slight contrast enhancement and pathological mass is visible in the right pyriform sinus apex and postcricoid area (arrows). Perfusion map of blood flow. The area of a high blood flow (mean value = 132 ml/100 g/min), representing malignant infiltration, is visible in right pyriform sinus apex, postcricoid area and along the right thyroid cartilage (arrows). Perfusion map of blood volume. The area of elevated blood volume (mean value = 5.72 ml/100 g) is marked with arrows and represents malignant infiltration.