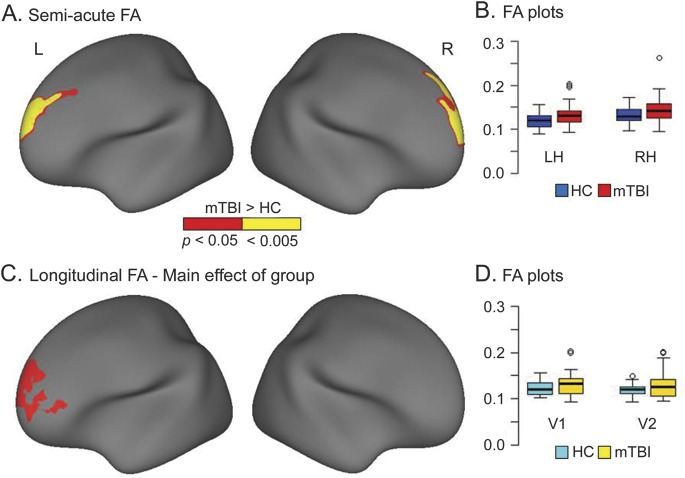
Figure 1. Semiacute and longitudinal group differences in FA.
(A) Regions showing increased fractional anisotropy (FA) for patients with mild traumatic brain injury (mTBI) relative to healthy controls (HCs) during the semiacute injury phase after correction for multiple comparison (α = 0.05). The magnitude of significance is denoted by color (red, corrected p < 0.05; yellow, p < 0.005), and data are presented for the right hemisphere (RH) and left hemisphere (LH). Regions included the left (Montreal Neurological Institute [MNI] coordinates = −16.5, 49.8, 27.3) and right (MNI coordinates = 12.3, 62.2, 15.8) superior frontal cortex. (B) Box-and-whisker plots used to denote the distribution of the FA within these regions for both patients with mTBI (red boxplots) and controls (blue boxplots). (C) Regions that exhibited a main effect of group in the FreeSurfer longitudinal pipeline analyses. Increased FA was again observed within the left (MNI coordinates = −16.3, 60.9, 6.5) superior frontal cortex for patients with mTBI. (D) Box-and-whisker plots used to denote the longitudinal changes in distribution of the FA within the left superior frontal cortex for returning patients with mTBI (n = 26; yellow boxplots) and matched controls (cyan boxplots) at both visits 1 (V1) and 2 (V2).

