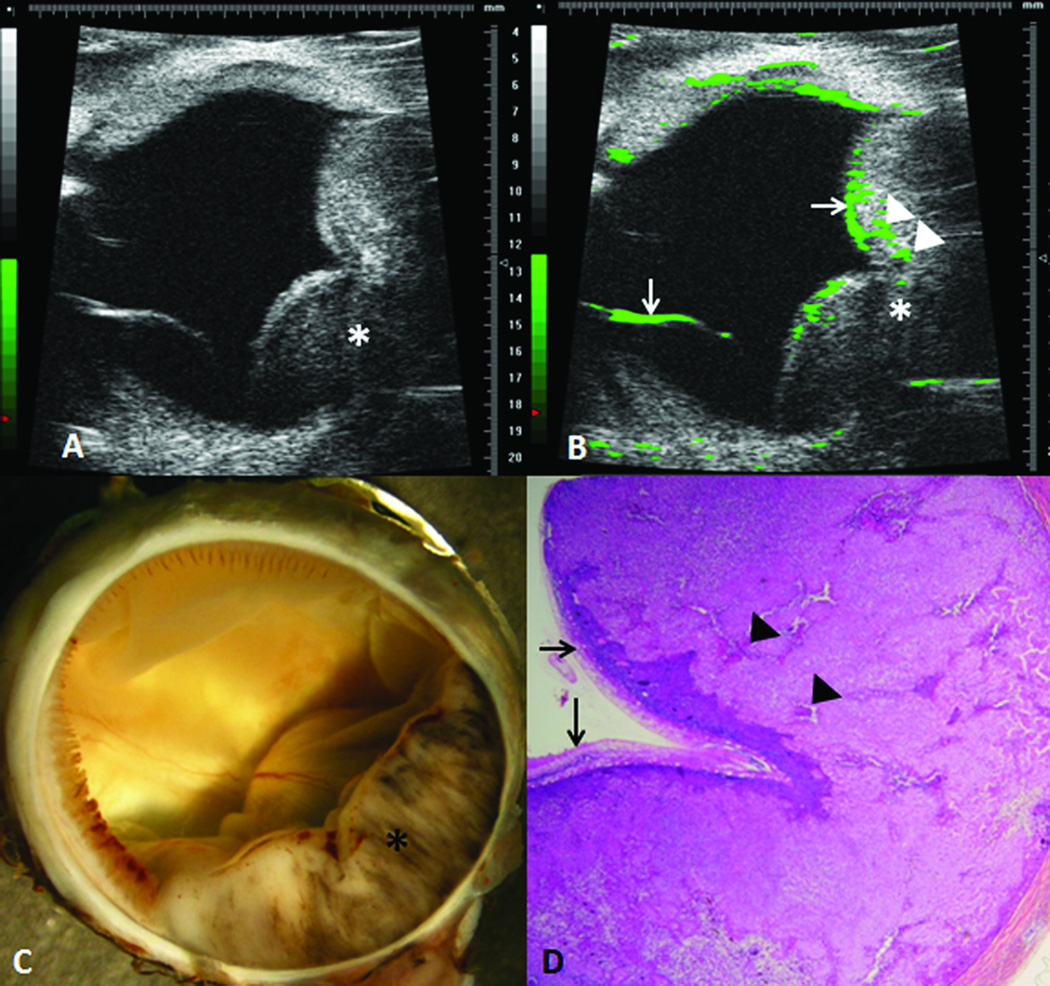
Figure 1.
Experimental choroidal melanoma in a rabbit. The intraocular tumor (*) is visualized with high-frequency ultrasound before (A) and after (B) contrast enhancement. The contrast enhanced regions are highlighted in green, including enhanced areas in the retina (arrows) and in the melanoma (arrowheads). The hyperechoic region in the ultrasound correlated with gross appearance of the melanoma (C) and the histologic findings (D). (D, hematoxylin and eosin, 25X)

