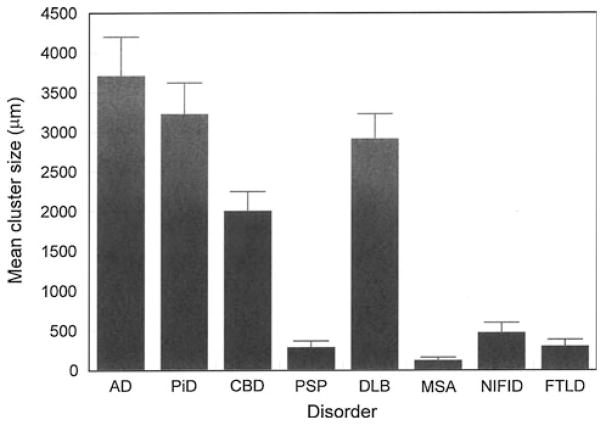
Fig. 6.
Mean cluster size of the neuronal cytoplasmic inclusions (NCI) in the cortex of Alzheimer’s disease (AD), Pick’s disease (PiD), corticobasal degeneration (CBD), progressive supranuclear palsy (PSP), dementia with Lewy bodies (DLB), multiple system atrophy (MSA), neuronal intermediate filament inclusion disease (NIFID), frontotemporal lobar degeneration with TDP-43 proteinopathy (FTLD-TDP). Analysis of variance (ANOVA) (one-way with Scheffé’s post hoc tests): Cluster size F = 14.73 (P <0.001); Significant differences between groups: AD >PSP, NIFID, FTLD; PiD >PSP, NIFID, FTLD; CBD >NIFID, FTLD; DLB >PSP

