
Fig. 5. PGCs isolated from tailbud stage embryos show high cellular motility.
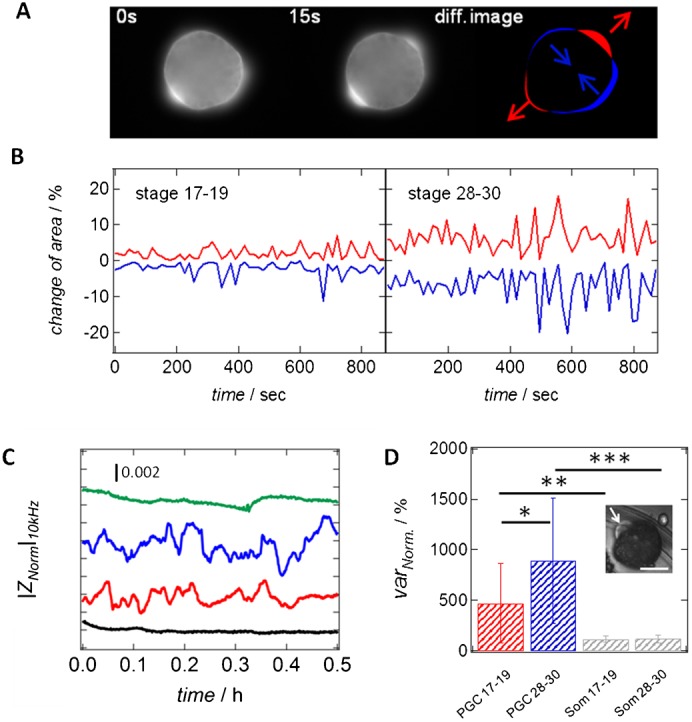
(A) Time-lapse fluorescence images of GFP-labeled PGCs from the migratory stage were taken with a time interval of 15 s. Subtracting two successive images from each other results in a difference image showing the expanding (red) and contracting (blue) regions of the cell over time. Arrows underscore the direction of expansion/contraction. (B) Time traces of the contracting (blue) and expanding (red) area of PGCs from the pre-migratory (stage 17–19) and the migratory (stage 28–30). Values are normalized to the current cell area at each time point and given in percentages. (C) Time-resolved, normalized and detrended impedance data of an uncovered electrode (black line), a single pre-migratory primordial germ cell (PGC stage 17–19, red line), a single migratory primordial germ cell (PGC stage 28–30, blue line) and a migratory primordial germ cell treated with 100 µM cytochalasin B (PGC stage 28–30, green line). All measurements were recorded at an excitation frequency of 10 kHz. The curves are arbitrarily shifted in the y-direction for better visibility. (D) Calculated variances obtained from time-resolved impedance data (C) for single pre-migratory primordial germ cell (PGC stage 17–19, n = 7, red) and single migratory primordial germ cell (PGC stage 28–30, n = 6, blue). Additionally, normalized variances of somatic endodermal cells from both stages of embryonic development (stage 17–19 with n = 4 and stage 28–30 with n = 6) are shown in grey. Values are given in percentages and normalized to the variance of the time-trace of an uncovered electrode (100%). N depicts the number of investigated cells per category. Error bars represent standard deviation. * corresponds to P-value<0.05 (P-value = 0.079), ** corresponds to P-value<0.1 (P-value = 0.028), *** corresponds to P-value<0.01 (P-value = 0.001). In all cases a Wilcoxon rank sum test was performed. Inlay: Single migratory PGC (stage 28–30) showing a strong formation of blebs (indicated by white arrow). Scale bar: 10 µm.