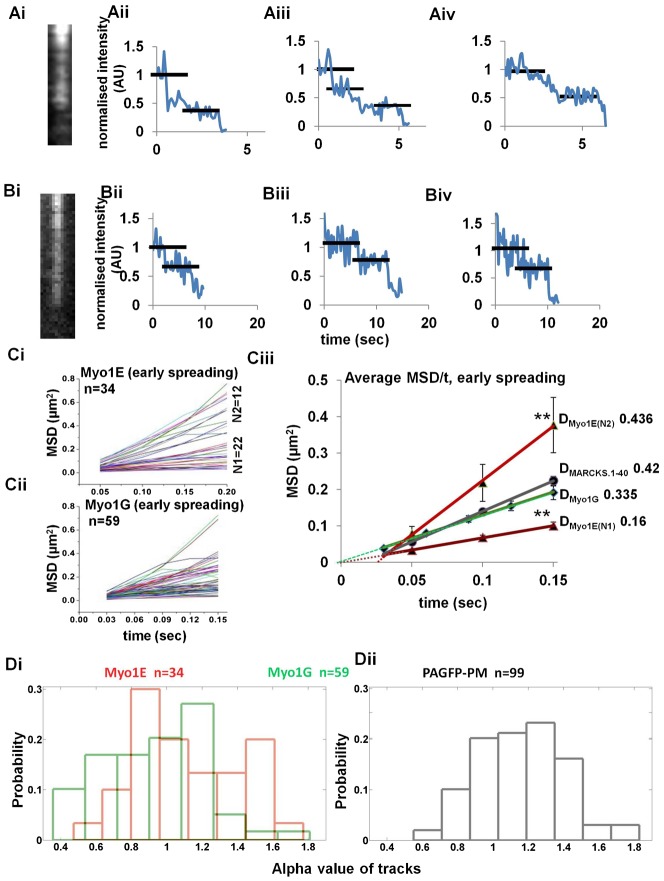
Fig. 3. Single particle analysis of Myosin 1E and Myosin 1G oligomers.
(A) Bleaching of mApple-Myosin 1E (Ai–Aiv)/EGFP-Myosin1G (Bi–Biv) particles observed in TIRF (formaldehyde–glutaraldehyde fixed sample). Examples shown have two or three bleaching steps (black bars, intensity were normalized to the original observations). (Ci) Summary of all MSD/time plots of Myosin 1E tracks in lamellipodial regions as selected in supplementary material Movie 7. Myosin 1E has two distinct group of tracks, N1 = 22, N2 = 12, total 34 tracks screened. (Cii) Summary of all MSD/time plot of Myosin 1G tracks in lamellipodial regions as selected in supplementary material Movie 8, total 59 tracks screened. (Ciii) Comparative average MSD/time plots of Myosin 1E, Myosin 1G and membrane diffusion control PAGFP-PM. Two groups of Myosin 1E tracks have significantly different average MSD values (P = 3.68E−09, at 0.15 sec **). (D) Distribution of alpha-values (as calculated in Materials and Methods by first four time points in logMSD/logtime) of Myosin 1E (red, Di) and Myosin 1G (green, Di) tracks during early spreading. (Dii) PAGFP-PM value distribution is shown as membrane diffusion control.

