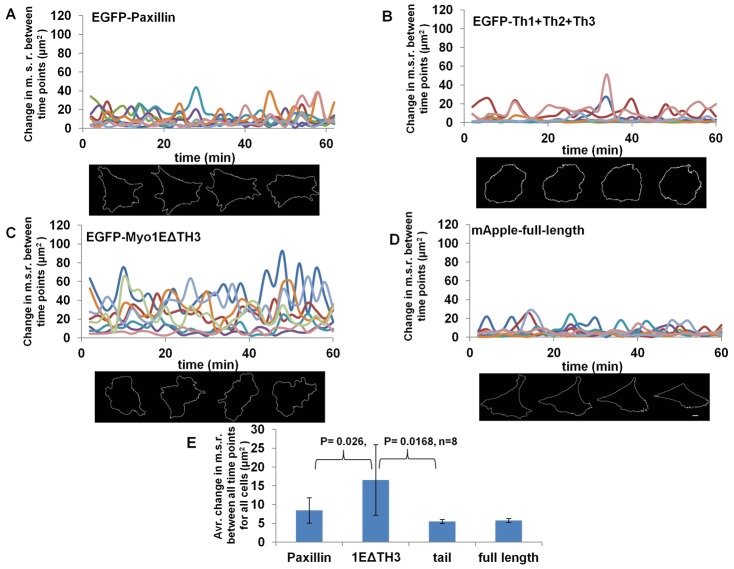
Fig. 5. Overexpression of Myosin 1E deletion mutants Myo1EΔTH3 and TH1+TH2+TH3 has opposite effect on lamellipodia dynamics.
Tracks of Mean-square radius (M.S.R.) fluctuations between timepoints and one representative cell each for expression of (A) EGFP-Paxillin, (B) EGFP-(TH1+2+3) of Myosin 1E, (C) EGFP-Myosin 1EΔTH3 and (D) mApple-Myosin 1E full length. (E) Average change in M.S.R. per frame (2 sec) of all four constructs (n = 8, each). Fluctuation of Myosin 1EΔTH3 is significantly higher from control (P = 0.26) and (TH1+2+3) (P = 0.0168), were as fluctuation of (TH1+2+3) is lower than control (P = 0.046) (supplementary material Movies 9–12). Bar 10 µm.

