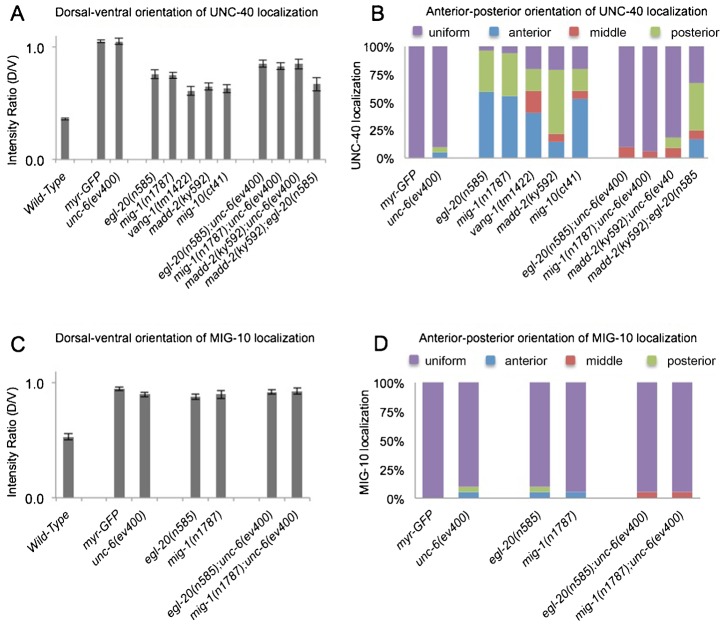
Fig. 6. Genes function to inhibit anterior and posterior UNC-40 localization.
(A) Graph indicating the dorsal–ventral orientation of UNC-40::GFP. The graph shows the average ratio of dorsal-to-ventral intensity from linescan intensity plots of the UNC-40::GFP signal around the periphery of the HSN cell. Wild-type animals show a strong ventral bias, whereas there is a uniform distribution in unc-6(−) mutants. In mutants there is an intermediate phenotype indicating a weak bias for ventral localization, as well as enrichment for localization at other sites compared to wild type (P<0.005, t-test). (B) Graph indicating the anterior–posterior orientation of UNC-40::GFP. To determine orientation, line-scan intensity plots of the UNC-40::GFP signal across the dorsal periphery of the HSN cell were taken, the dorsal surface was geometrically divided into three equal segments, and the total intensity of each was recorded. The percent intensity was calculated for each segment and ANOVA was used to determine if there is a significant difference between the three segments (see Materials and Methods). The measurements were taken using only the dorsal periphery in order to minimize cell shape differences. In several mutants there is a bias for anterior or posterior localization. (C) Graph indicating the dorsal–ventral orientation of MIG-10::GFP. The graph shows the average ratio of dorsal-to-ventral intensity from linescan intensity plots of the MIG-10::GFP signal around the periphery of the HSN cell. MIG-10 is ventrally localized in wild type, but the ratio is different in unc-6(−) and the mutants (P<0.005, t-test) because MIG-10 is uniformly distributed along the dorsal–ventral axis. (D) Graph indicating the anterior–posterior orientation of MIG-10::GFP. To determine orientation, line-scan intensity plots of the MIG-10::GFP signal across the dorsal periphery of the HSN cell were taken and analyzed as in Fig. 2B. There is a uniform distribution in unc-6(−) mutants and the mutants along the anterior–posterior axis. Error bars represent standard error of mean. n>15.

