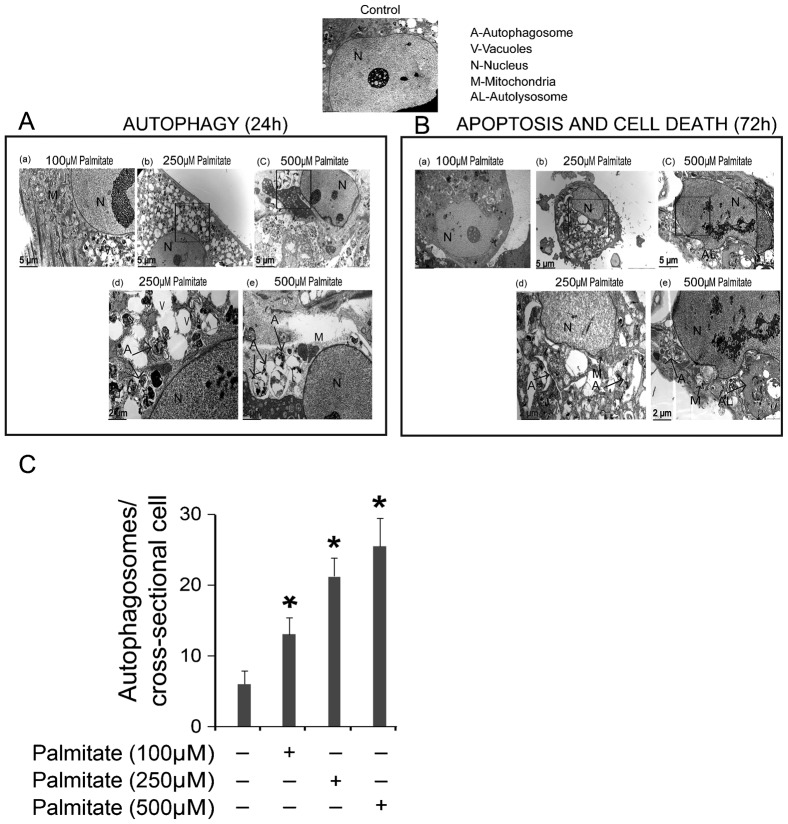
Fig. 3. Ultrastructure of Ob treated with PA.
(A) Transmission electron micrograph of Ob showing autophagic vacuoles and autophagosomes after 24 h treatment with PA. The cytoplasm and nucleus of untreated cells appear normal. Panels (a–c) show cells treated with increasing doses of PA (100, 250, and 500 µM). Cells exhibited not only cytoplasmic lipid droplets but also the characteristic ultrastructural morphology of autophagy: vacuoles, isolated double-membrane and double-membrane autophagosomes, which engulfed the cytoplasm fraction and organelles, were distributed throughout the cytoplasm. Panels (d–e) are higher magnification images and show examples of autophagosomes. (B) The initial autophagy changes were followed by cell shrinkage and nuclear fragmentation after 72 h of treatment with PA. Panels (a–c) show cells treated with increasing doses of PA (100, 250, and 500 µM). Morphological features of apoptosis and autophagy coexisted in Ob treated at the higher doses of PA. Panels (d–e) are higher magnification images showing typical autolysosomes, mitochondrial deformity and nuclear fragmentation. (C) Quantification of autophagosomes in Ob treated with PA for 24 h. *P<0.01 vs. control.

