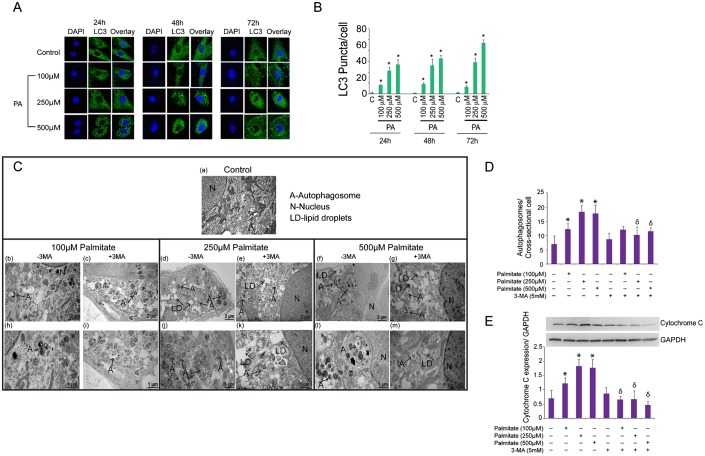
Fig. 4. PA induces autophagy in Ob, which is prevented by 3MA.
(A) Ob were grown on glass coverslips, treated with PA (100, 250, and 500 µM) for 24, 48 and 72 h and processed for immunofluorescence. Whole cells were fixed in 4% paraformaldehyde, permeabilized and stained with rabbit anti-LC3 followed by anti-rabbit Alexa 488. All images are at equal magnification and were processed and acquired identically (60×). (B) Quantification of the number of LC3 puncta per cell in ten fields from ten different cells in two independent coverslips after treatment with PA for 24, 48 and 72 h. *P<0.01 vs. control. (C) Changes in autophagy induced by 3MA treatment in PA-treated Ob. Ob were treated with PA 100 µM PA (b,h), 250 µM PA(d,j), or 500 µM PA(f,l) for 48 h and processed for EM. Higher number and larger autophagosomes were seen at higher concentrations of PA. Other groups of Ob were treated with 3MA (5 mM) together with 100 µM PA (c,i), 250 µM PA (e,k), or 500 µM PA (g,m) for 48 h. The larger autophagosomes were observed at higher concentrations of PA (j,l). A, autophagosomes; N, nucleus; LD-lipid droplets. (D) Quantification of autophagosomes in Ob treated with PA (100, 250, and 500 µM) with or without 3MA for 24 h. *P<0.01 vs. control. δP<0.01 3MA-treated vs. their corresponding untreated group according to the dose of PA. (E) Quantification of cytochrome C expression against GAPDH using image J software. *P<0.05 vs. control. δP<0.01 3MA-treated vs. their corresponding untreated group according to the dose of PA.

