
Fig. 1. Loss of PC following INT depletion.
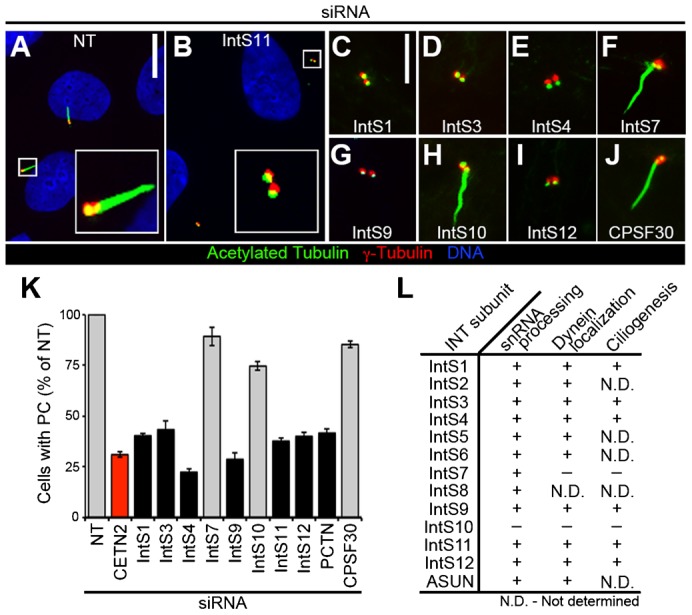
RPE cells were transfected with siRNA, serum-starved, fixed, and stained for acetylated tubulin, γ-tubulin, and DNA. (A–J) Representative images show decreased PC formation after knockdown of most INT subunits tested. Scale bars, 10 (A,B) or 5 (C–J) µm. (K) Quantification of PC formation (normalized to NT-siRNA) in INT-depleted cells. Gray, P<0.0001; black, not significant (both relative to CETN2-siRNA, red). (L) Comparison of INT subunit requirements in snRNA processing (Chen et al., 2012), dynein localization, and ciliogenesis (presented herein). (+), required; (−), not required; (N.D.), not determined.