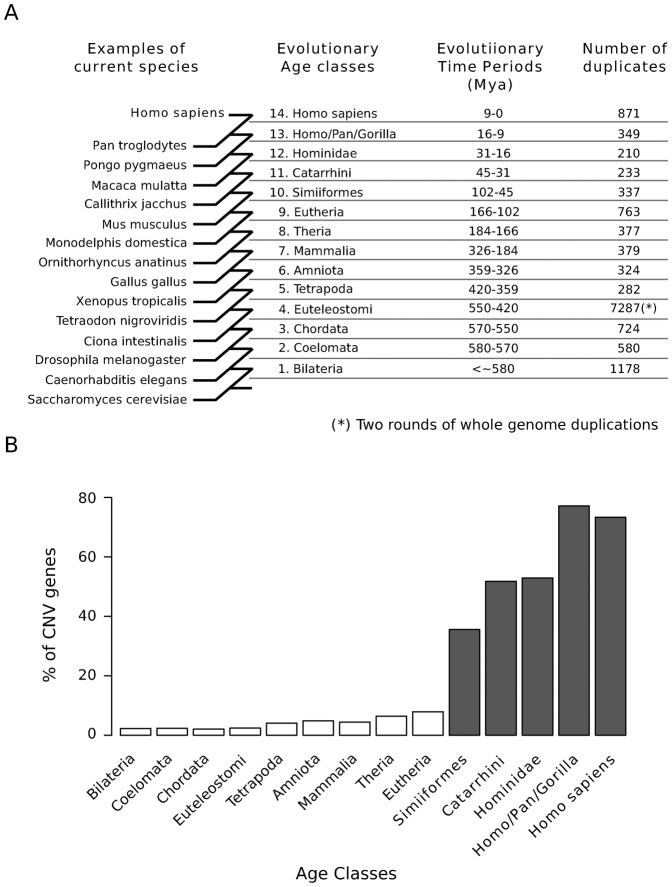
Fig. 2. Phylostratification of human PDGs.
(A) The age of a duplicated gene represents the ancestral species in which the duplication event that led to the generation of the extant gene was detected. A total of 13,909 gene duplicates were assigned to one of the 14 different evolutionary age groups (or phylostrata). Representative extant species that define the gene age classes are indicated (see Table 1 for the complete list). (B) The proportion of CNV genes in each phylostratum is higher in the genes recently duplicated in evolution (P-value <10−150, chi-squared test). A similar result was observed when only CNV gains are considered (supplementary material Fig. S1).

