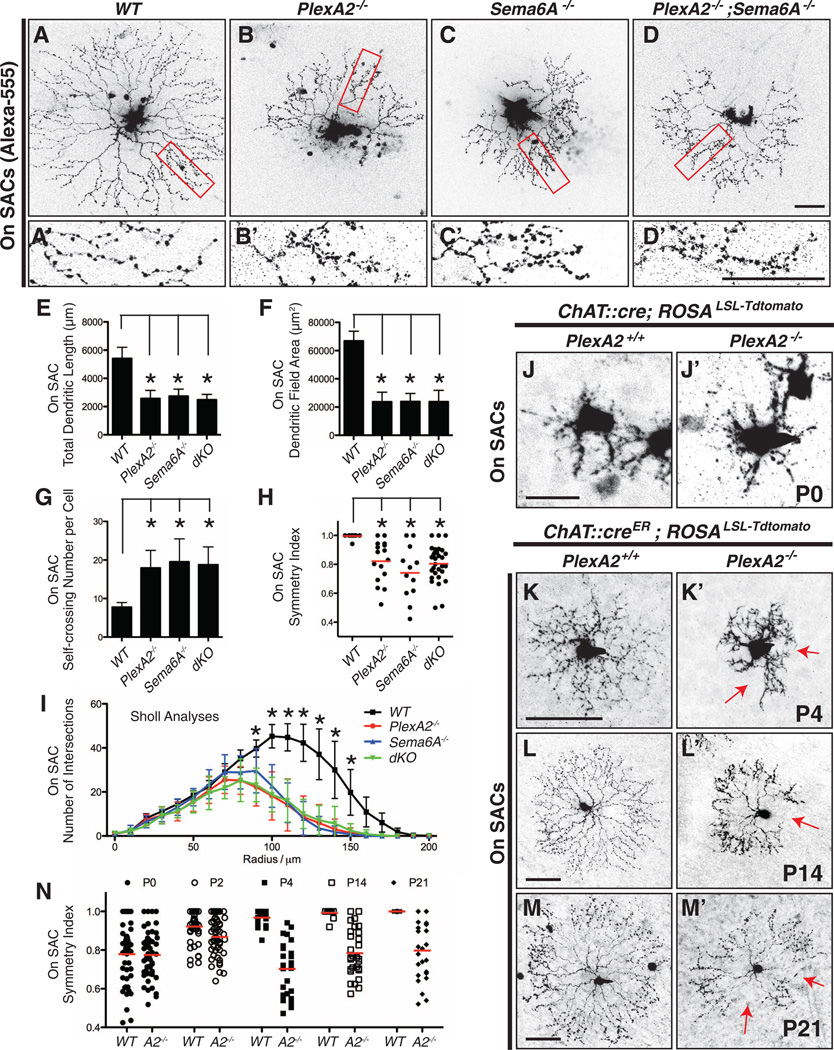
Fig. 3. Sema6A-PlexA2 signaling regulates dendritic arborization and symmetric organization in On SACs.
(A to D) Single On SACs labeled with Alexa-555 in WT (A), PlexA2−/− (B), Sema6A−/− (C), and PlexA2−/−;Sema6A−/− (D) adult retinas. (A′ to D′) Single-plane confocal images of magnified fields in (A) to (D) (red rectangles) show that higher-order distal dendrites in PlexA2−/− (B′), Sema6A−/− (C′), and PlexA2−/−;Sema6A−/− (D′) retinas exhibit self-avoidance defects in comparison with WT (A′). (E to I) Quantification of total dendritic length (E), dendritic field area (F), self-crossing number per cell (G), symmetry index (H), and dendritic complexity (I, measured by Sholl analyses) shows that overall dendritic morphology is disrupted in PlexA2−/−, Sema6A−/−, and PlexA2−/−;Sema6A−/− retinas (n ≥ 12 SACs per genotype). Error bars, mean ± SD. *P < 0.01. (J to M′) Sparse genetic labeling of On SACs in WT retinas [(J) to (M)] shows that dendritic morphology of On SACs is not symmetric at P0 (J) but becomes symmetric during the course of early postnatal retinal development [(K) to (M)]. PlexA2−/− On SACs (J′) are indistinguishable from WT (J) at P0; however, they fail to establish dendritic process symmetry by P4 [red arrows in (K′)] and throughout retinal development [red arrows in (L′) and (M′)]. (N) Quantification of the symmetry index in WT and PlexA2−/− retinas through early postnatal retinal development. Red bars in (H) and (N) represent the mean value for each genotype. Scale bars, 50 µm in (D) for (A) to (D), 50 µm in (D′) for (A′) to (D′), 20 µm in (J) for (J) and (J′), 50 µm in (K) for (K) and (K′), 50 µm in (L) for (L) and (L′), and 50 µm in (M) for (M) and (M′).

