Figure 2.

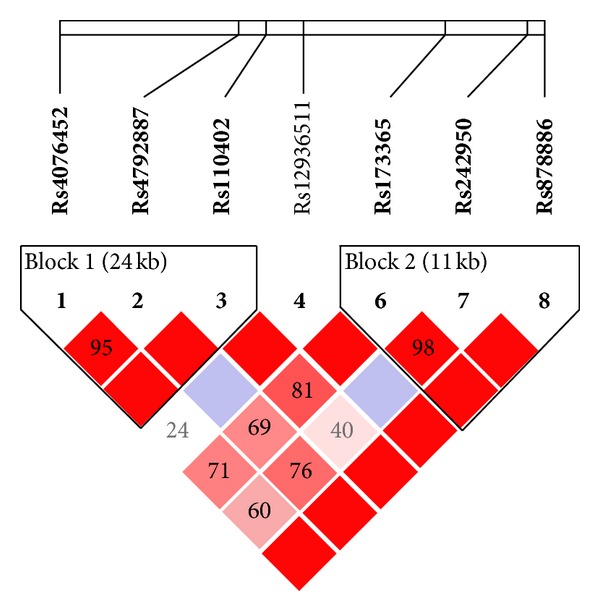
Relative positions and LD estimates between AVPR1b polymorphisms in the analyzed population. Coloured squares correspond to D′ values with numerical estimates given within the squares.

Relative positions and LD estimates between AVPR1b polymorphisms in the analyzed population. Coloured squares correspond to D′ values with numerical estimates given within the squares.