Figure 5.

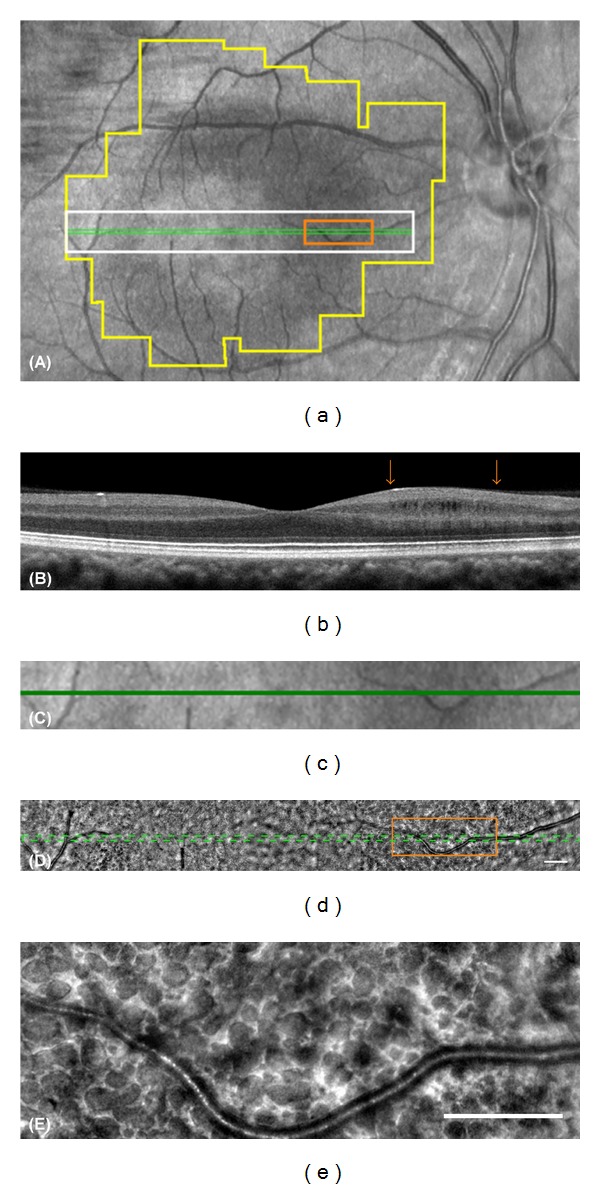
The localization and the structure of microcystic macular edema in Patient 1-II-1. (a) An infrared image of the macular region of the patient. The box outlined in green lines shows the area scanned to obtain the OCT image in (b). A white box indicates the area shown in (c) and (d). An orange box indicates the area shown in (e). A polygonal area outlined in yellow is the area shown in Figure 6(a). (b) SD-OCT image of the patient shows cystic lacunar areas of hyporeflectivity with clear boundaries in the nasal region. The RNFL is almost lost in this area. Arrows indicate the edge of the area outlined in orange in (a) and (d). (c) Magnified infrared image outlined in white in (a) is shown. A green line indicates the area scanned to obtain OCT image (b). (d) Montage of AO image corresponding to area (c) is shown. Note that retinal blood vessels are shown in exactly the same region in the images (c) and (d). (e) Magnified AO image outlined in orange in (a) and (d) is shown. The AO image shows various size dark reflectance areas outlined by hyperreflective region and most are oval shaped. Bars in (d) and (e) indicate 200 μm.
