
Figure 1.
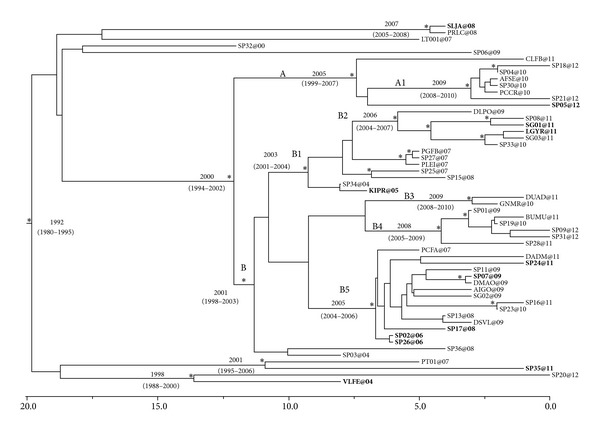
Bayesian time-scaled tree of the 55 HIV-1 CRF 02_AG pol sequences from MSM. The numbers at the root and at the internal nodes represent the estimated date of the origin and the uncertainty indicated by 95% highest posterior density (95% HPD) intervals. The asterisks (∗) along a branch represent significant statistical support for the clade subtending that branch (posterior probability >98%). Non-Italian sequences are in bold. The line at the bottom represents time (in years).