
Figure 4.
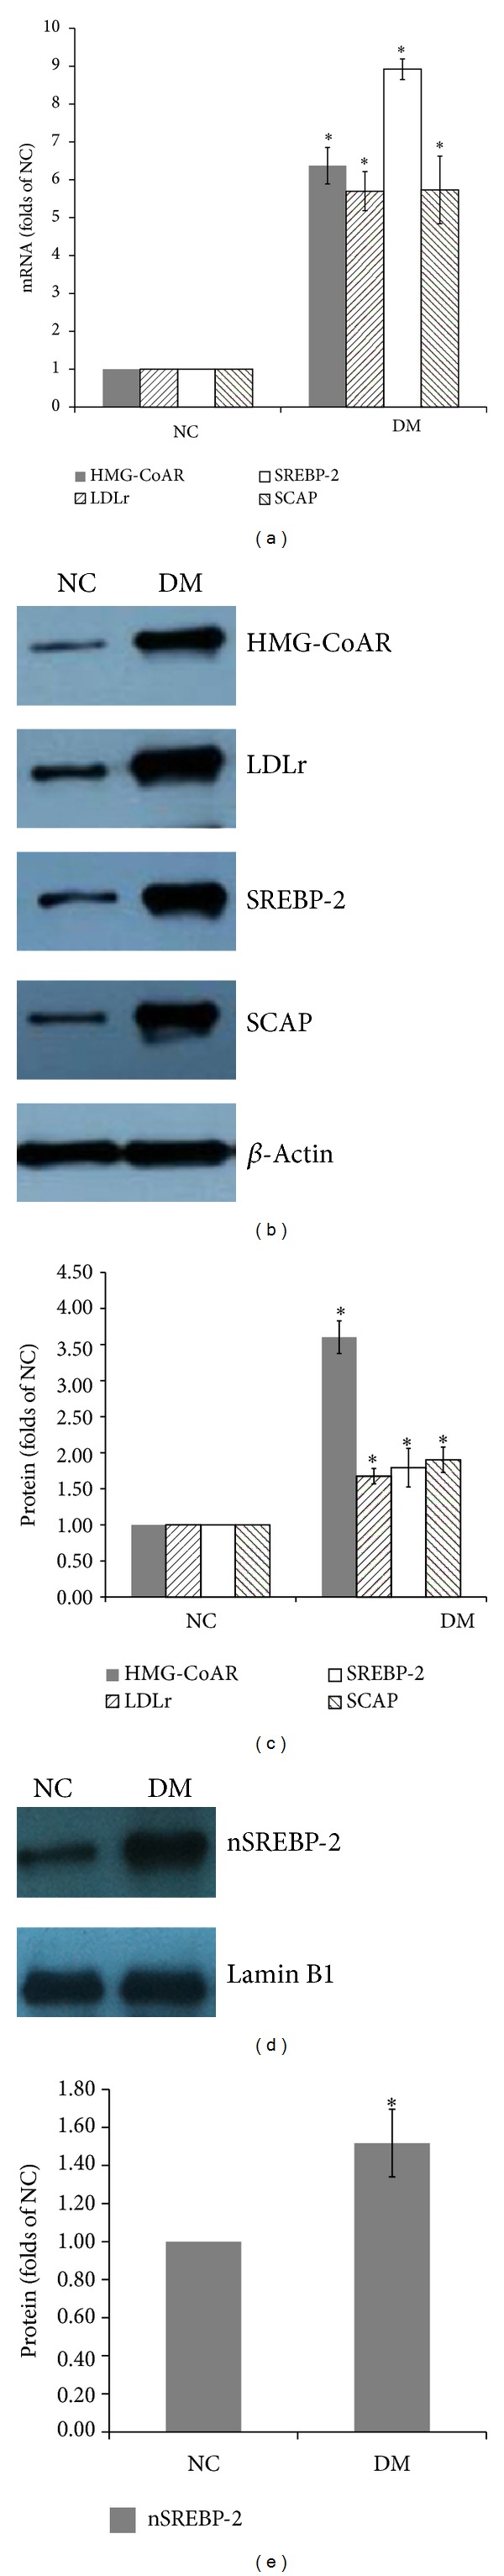
mRNA and protein expressions of HMG-CoAR, LDLr, SREBP-2, SCAP, and nSREBP-2. mRNA levels were determined by real-time RT-PCR as described in Section 2. GAPDH was used as a reference gene. Data are presented as means ± SD (a). The protein levels were examined by western blot (b). The histogram represents means ± SD of the densitometric scans of HMG-CoAR, LDLr, SREBP-2, and SCAP proteins, normalized by comparing with actin. This result is expressed as a percentage of control (c). The protein level and histogram of nSREBP-2. Data are means ± SD ((d) and (e)). *P < 0.05 versus NC.