
Figure 2.
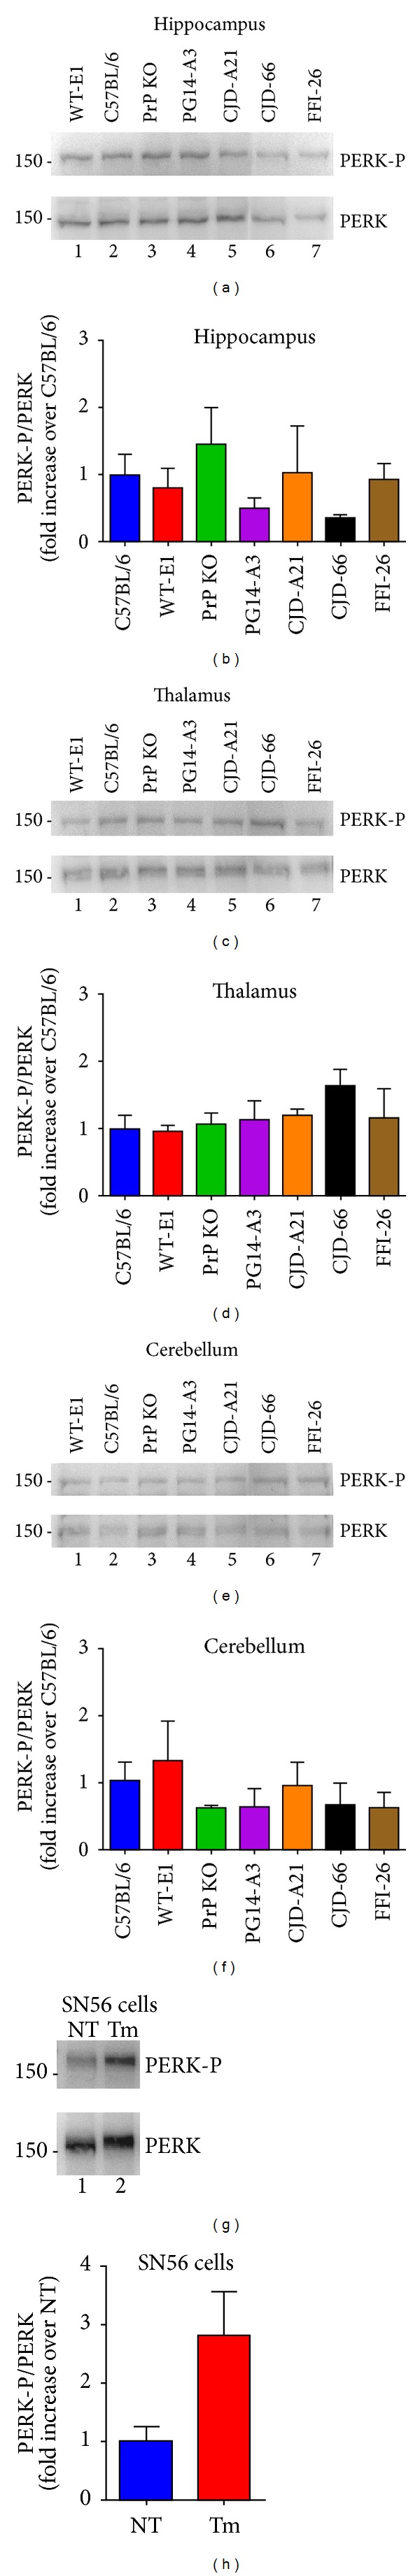
Phosphorylation of PERK is not increased in the brains of mutant PrP mice. Phosphorylation of PERK was evaluated in brain extracts of the following mice: C57/BL6J (PrP level 1X), PrP KO (C57BL/6J/Prnp 0/0, European Mouse Mutant Archive, Rome, Italy; EM: 01723), Tg(WT-E1+/+) overexpressing 3F4-tagged wild-type PrP at ~4X, Tg(PG14-A3+/−) expressing 3F4-tagged PG14 PrP at ~1X, Tg(CJD-A21+/−) expressing 3F4-tagged D177N/V128 PrP at ~1X, Tg(CJD-66+/−) expressing untagged D177N/V128 PrP at ~2.5X, and Tg(FFI-26+/−) mice expressing untagged D177N/M128 PrP at ~2.5X. These mice were originally generated on a C57BL/6J X CBA hybrid and then bred with C57BL/6J/Prnp 0/0 mice ([92, 93] and manuscript in preparation). Proteins were extracted from the hippocampus, thalamus, and cerebellum of mice of the indicated strains/genotype ((a)–(f)) or from SN56 cells ((g) and (h)), using a lysis buffer containing 50 mM Tris, 150 mM NaCl, 2 mM EDTA, 1 mM MgCl2, 100 mM NaF, 10% glycerol, 1% Triton X-100, 1% Na deoxycholate, 0.1% SDS, and 125 mM sucrose, supplemented with Phos-STOP and protease inhibitors (Roche) [80]. Protein extracts (50 μg) were analyzed by Western blot with anti-PERK-P and antitotal PERK antibodies (1 : 1000; Cell Signaling) ((a), (c), (e), and (g)). Molecular mass markers are in kilodaltons. Phosphorylation levels were quantified by densitometric analysis of Western blots and expressed as the -fold increase over the level in C57BL/6 mice ((b), (d), (f), and (h)). Tunicamycin (Tm) treated HeLa cells were analyzed at 2 hours as control for UPR activation. Each value is the mean ± SEM of three animals of 300–350 days of age or from three independent cell preparations.