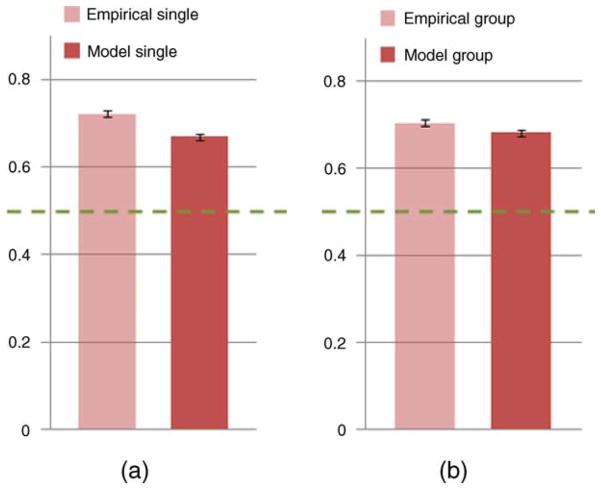
Figure 15.
Comparison of predictive power (ROC method) between our model and the subject population for individual and group data. (a) Prediction of individual data: Population is estimated by the other subjects’ eye fixation data except the one that is predicted. (b) Prediction of group data: Population is estimated by the other half of subject group’s fixation data. Error bars indicate standard error of the mean, and dotted lines indicate the chance level (0.5).

