
Figure 2.
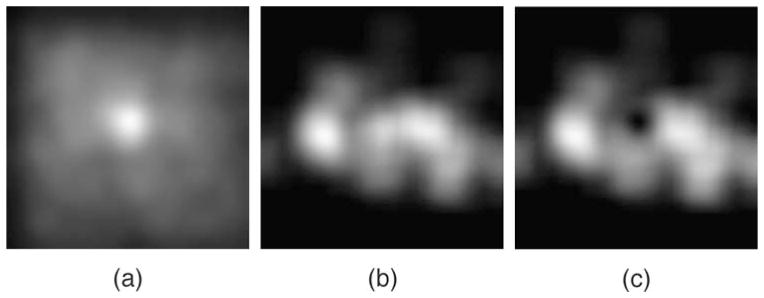
Controlling for the natural search bias. Brighter areas indicate greater fixation density. (a) Combined fixation distribution across the 160 search trials. (b) Fixation distribution in trial #26. (c) Final attentional landscape for trial #26 after controlling for the bias.