
Figure 3.
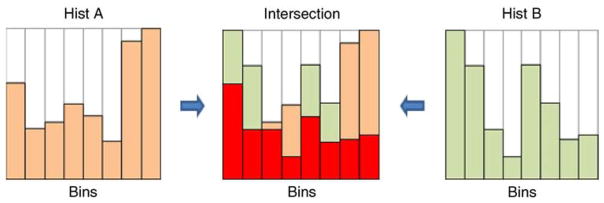
Histogram Intersection Similarity Method (HISM). Histograms have eight bins and are normalized so that their minimum value is 0 and their maximum value is 1. Histograms A (left) and B (right) are examples of target and local feature histograms, respectively. Their intersection (center) consists of the smaller of the two values in corresponding bins. The size of the red area is our measure of similarity between target and local histograms.