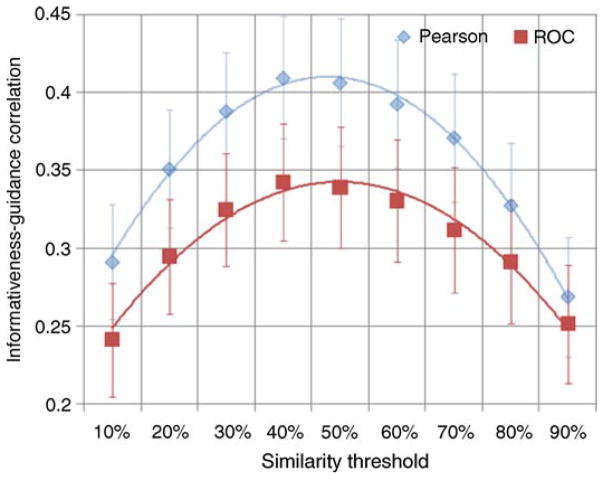
Figure 9.
Average correlation between informativeness and guidance for the eight feature dimensions across the 160 search trials as a function of the similarity threshold. Both guidance measures (Pearson and ROC) reveal maximum correlation in the threshold range of approximately 40% to 50%. Curves indicate quadratic function fits, and error bars indicate standard error of the mean across dimensions.

