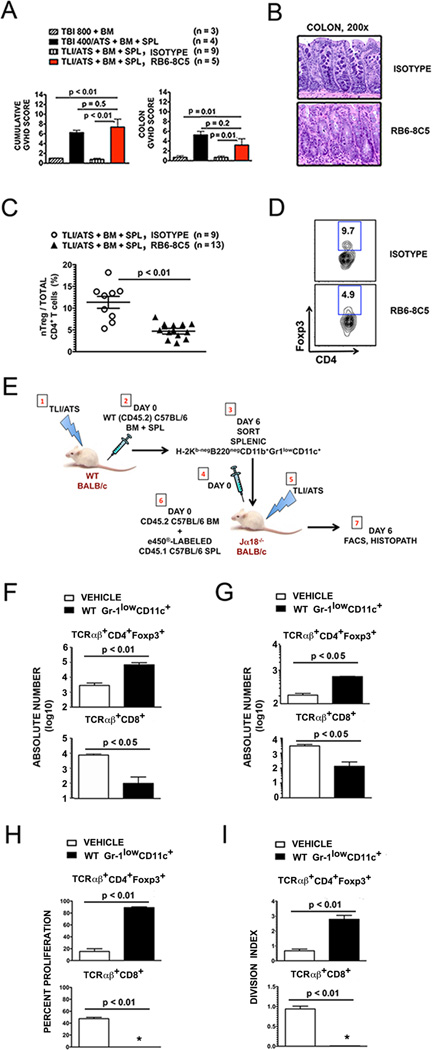
Figure 5. Depletion of recipient Gr-1+ cells before TLI/ATS + BMT results in acute GVHD.
(A) Mean ± SEM cumulative GVHD scores (left panel) and mean ± SEM colon GVHD scores (right panel) of recipient mice at day 6 after TLI/ATS and BMT treated with rat IgG2a isotype control antibody (n = 9) or the anti-Ly6C/Ly6G antibody RB6-8C5 (n = 5). (B) Representative photomicrographs of the hematoxylin/eosin-stained colon sections (200×) of recipient mice and treated with isotype control (top panel) or RB6-8C5 (bottom panel) during conditioning with TLI/ATS, followed by BMT from WT C57BL/6 donors. (C) Mean ± SEM percentage CD4+Foxp3+ nTreg amongst total gated H-2Kb+TCRαβ+CD4+ cells in colon of recipients at day 6 after TLI/ATS and treatment with isotype antibody (n = 9) or RB6-8C5 (n = 13). Data represent n = 4 separate experiments. (D) Representative FACS plots of Foxp3 and CD4 staining of gated H-2Kb+TCRαβ+CD4+ cells in colonic mononuclear cells isolated from recipients at day 6 from the experiments shown in Figure 3C. (E) Method of WT Gr-1lowCD11c+ cell adoptive transfer to iNKT-deficient Jα18−/− recipients of TLI/ATS. (1–3), 1 × 10⁵ H-2Kb-negB220negCD11b+Gr-1lowCD11c+ cells were sorted from pooled spleens of WT BALB/c mice at day 6 following TLI/ATS + BMT and adoptively transferred (4) to Jα18−/− recipients of TLI/ATS (5) 4 hours prior to BMT consisting of e450-labeled CD45.1 C57BL/6 splenocytes and unlabeled WT C57BL/6 BM (6). Control Jα18−/− recipients of TLI/ATS received vehicle (PBS) prior to BMT. (7) At day 6, GVHD target organs were harvested and prepared for FACS and histopathologic analysis. Absolute numbers of cell subsets were calculated for individual mice. Percent proliferation and division index were calculated on analyses for n = 2–3 pooled spleens per experiment, n = 2–3 experiments. (F) Mean ± SEM absolute number (log 10) H-2Kb+CD4+Foxp3+ nTreg (top panel) and H-2Kb+TCRαβ+CD8+ effector cells (bottom panel) in spleens of Jα18−/− recipients shown in E receiving vehicle (n = 5) or sorted H-2Kb-negB220negCD11b+Gr-1lowCD11c+ cells (n = 5). Data represent n = 2–3 separate experiments. (G) Mean ± SEM absolute number (log 10) of gated H-2Kb+CD4+Foxp3+ nTreg (top panel) and H-2Kb+TCRαβ+CD8+ effector cells (bottom panel) in colons of Jα18−/− recipients shown in E. (H) Mean ± SEM percent proliferation of gated H-2Kb+CD4+Foxp3+ nTreg (top panel) and H-2Kb+TCRαβ+CD8+ effector cells (bottom panel) in spleens of Jα18−/− recipients shown in E. *: < 1% proliferation. (I) Mean ± SEM division index (DI) of gated H-2Kb+CD4+Foxp3+ nTreg (top panel) and H-2Kb+TCRαβ+CD8+ effector cells (bottom panel) in spleens of Jα18−/− recipients shown in E. *: DI < 0.1. WT: wild-type host; TBI: total body irradiation; TLI: total lymphoid irradiation; ATS: anti-thymocyte serum; BM: 50 × 106 donor bone marrow cells; SPL: 60 × 106 donor spleen cells; 800TBI, 400TBI: cumulative dose of TBI (cGy).

