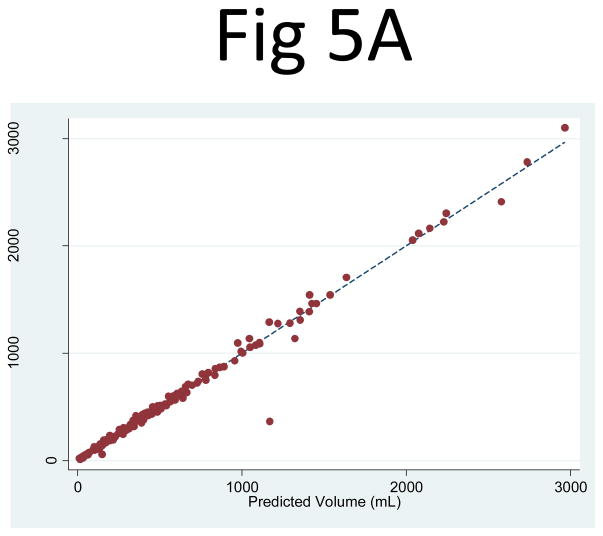
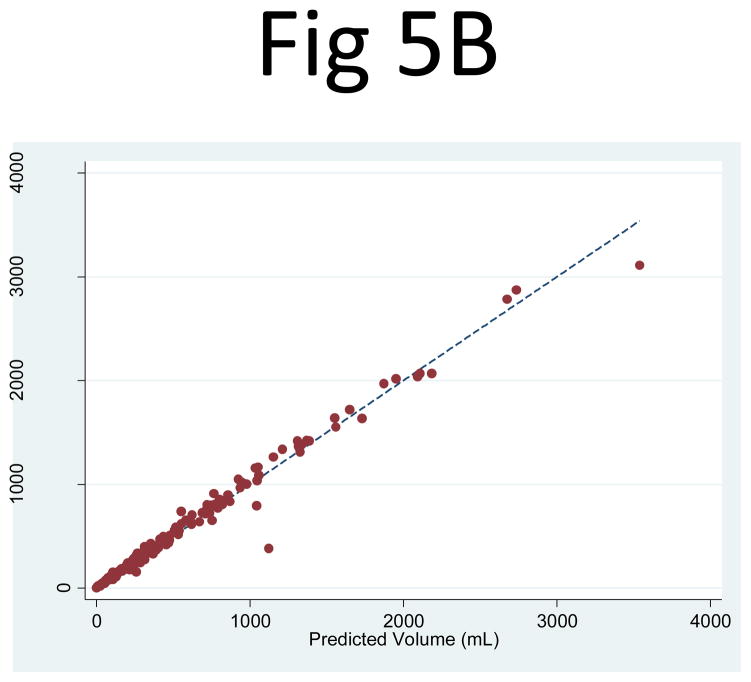
Fig 5. Comparison of the observed cyst volume measurements and the product of the three-slice area and the number of slices for (A) the right and (B) left kidney.
The correlation between the observed cyst volume measurement and (PANC1, PANC2, PANC3) as three independent variables in a linear combination was extremely strong: R2 = 0.992 (95% CI: 0.979, 0.999) for the right and 0.989 (95% CI: 0.979, 0.998) for the left kidney.


