
Figure 5.
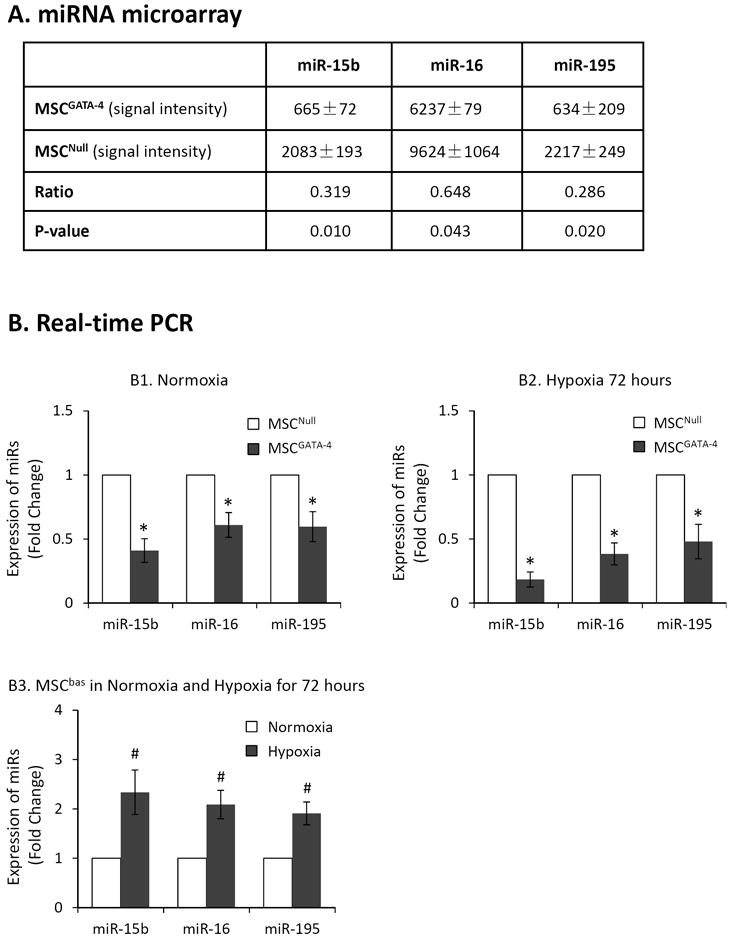
The expression of miR-15 family members in MSCGATA-4 and MSCNull evaluated by using miR microarray and quantitative real-time PCR. Panel A: miR-microarray data expressed as signal intensity. Panel B: real-time PCR expressed as fold change. MSCGATA-4 and MSCNull were cultured under normoxia (B1) and hypoxia (B2), respectively. B3: Comparison the expression of miR-15 family members in MSCbas under normal and hypoxic condition for 72 hours. *, p<0.05 vs MSCNull. #, p<0.05 vs normal culture, respectively.