
Figure 2. Distribution of estimated uncertainties determined from simulated data sets.
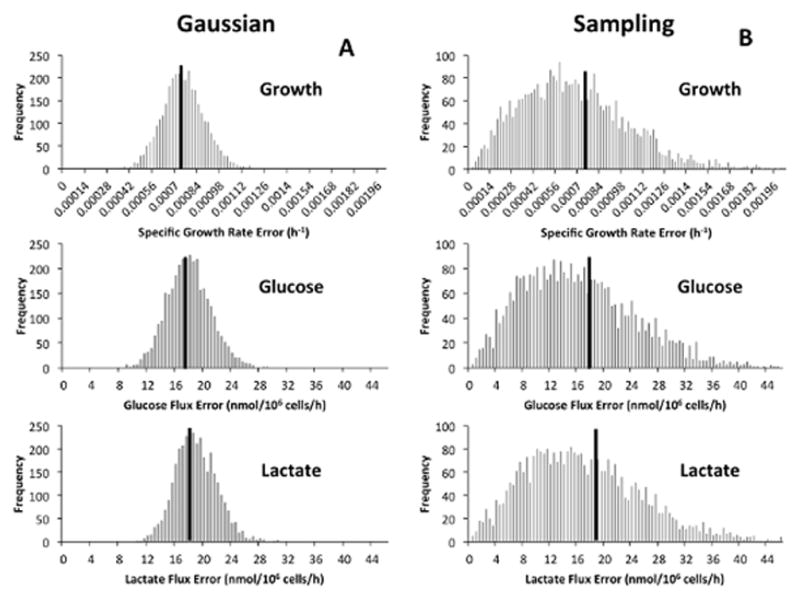
Histograms describing the distribution of uncertainties for specific growth, glucose uptake, and lactate excretion rates are shown for both (A) Gaussian error propagation and (B) Sampling rate estimates from replicate experiments. The solid black lines represent the Monte Carlo estimate of the true uncertainty of the estimated rates, which is given by .