
Figure 3. Features of the ETA software package.

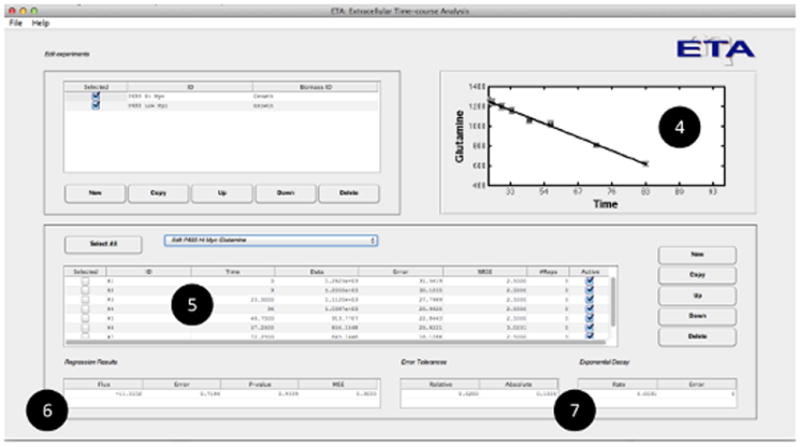
(A) Users are able to (1) create new experimental time courses and view the calculated rate (or yield) estimates and associated uncertainties in both (2) graphical and (3) tabular formats for either exponential or linear growth models. (B) When a single measurement is selected, the program allows the user to (4) graphically assess the goodness-of-fit, (5) enter and select raw data for regression, and (6) view the calculated rates along with the p-value and mean-square error of the fit. Adjustable error tolerances and first-order degradation parameters can also be supplied by the user (7).