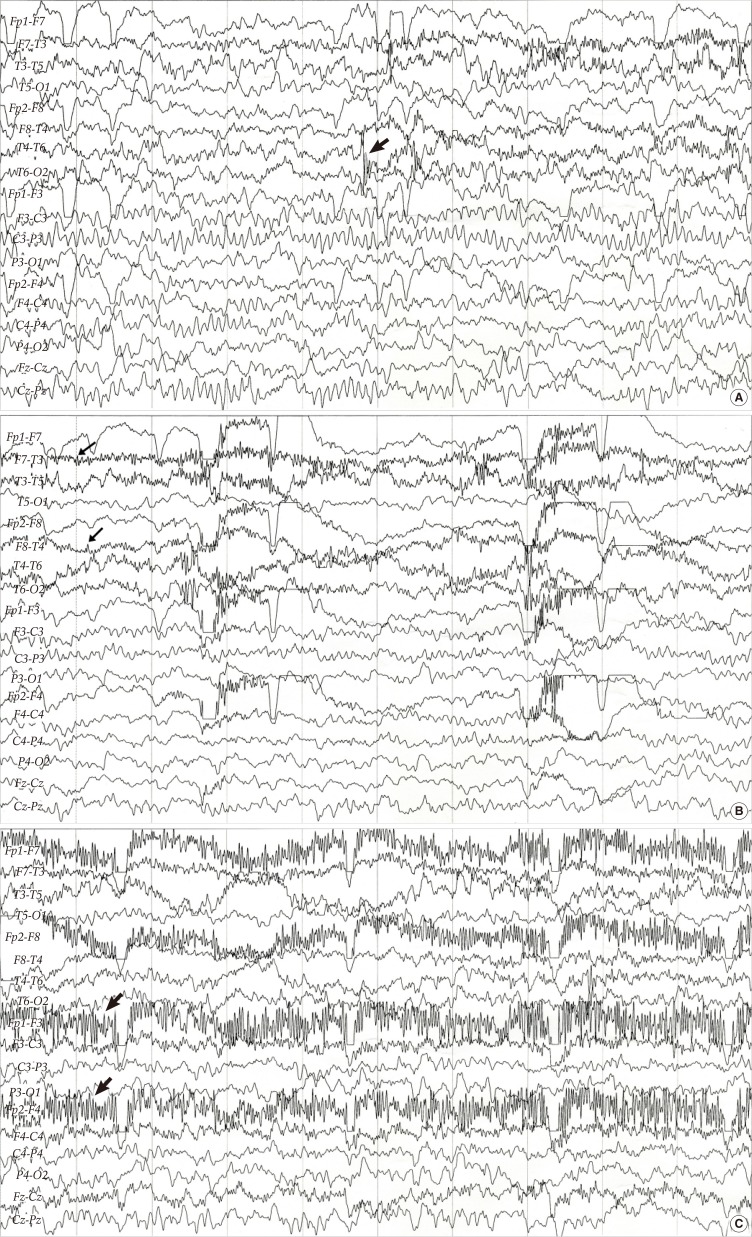
Fig. 1.
Ictal electroencephalography shows (A) initial rhythmic fast spikes with discharges in the right temporal area (arrow) during the onset of nystagmus and vertigo and (B) continued rhythmic fast spikes in bilateral temporal regions (arrow). Which were followed by (C) rhythmic fast frequency spikes in the bilateral frontal area (arrow). Fp, frontopolar; F, frontal; C, cental; T, temporal; P, parietal; O, occipital; Even number, right; Odd number, left.

