
Figure 2.
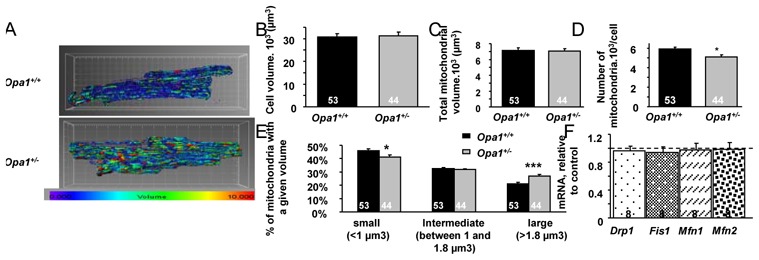
Morphological description of the mitochondrial network. (A) Representative pictures obtained with Mito-Tracker orange and IMARIS software. Each mitochondrion is identified by a color in accordance with its volume (the smallest mitochondria are blue and the largest are red). (B) Cell volume measured by calcein loading and IMARIS analysis. (C) Total mitochondrial volume quantified by IMARIS. (D) Number of mitochondria per cell. (E) Percentage of mitochondrial size categories. (F) Level of proteins involved in mitochondrial dynamics (Drp1, Mfn1, Mfn2) in Opa1+/+ and Opa1+/− cardiac tissue estimated by Western Blot analysis (normalized to citrate synthase level). *p<0.05; ***p<0.001 versus Opa1+/+.