
Figure 3.
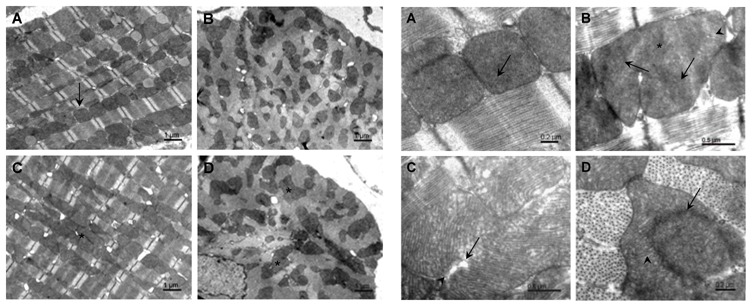
Electron micrographs of mitochondria in cardiomyocytes from Opa1+/+ and Opa1+/− mice. Upper Panel: Longitudinal (A) and transverse (B) sections of Opa1+/+ cardiomyocytes show individual mitochondria (arrow). Longitudinal (C) and transverse (D) sections of Opa1+/− cardiomyocytes demonstrate mitochondrial clusters (asterisks).
Lower Panel: (A) Opa1+/+ cardiomyocytes. Cristae are homogeneously distributed in the mitochondria (arrow). B–D Opa1+/− cardiomyocytes showing enlarged mitochondria and incompletely fused cristae. (B.) Cristae spreading in different directions (arrows); area of disintegrated cristae (asterisks); area of deformation of cristae (arrowhead). (C) Fragmented cristae (arrow); separation between inner and outer mitochondrial membranes (arrowhead). (D) Regions of incomplete mitochondrial fusion (arrow). Note that the peripheral part of the mitochondrion contains normal cristae (arrowhead).