
Figure 5.
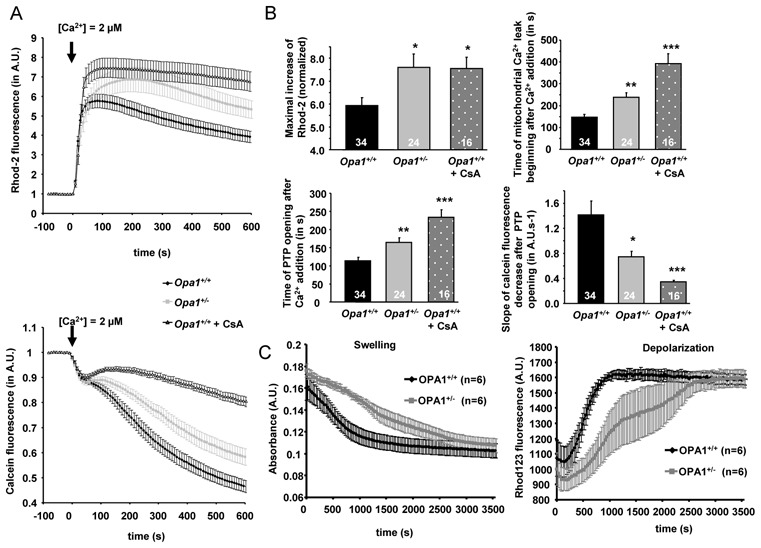
Kinetics of mitochondrial calcium loading and PTP opening in permeabilized cardiomyocytes and isolated mitochondria of Opa1+/+ and Opa1+/− mice. (A) Upper panel: time course of mitochondrial calcium accumulation following Ca2+ addition (indicated by arrow) measured by Rhod-2 fluorescence. Lower panel: time course of mitochondrial calcein fluorescence following Ca2+ addition (indicated by arrow). (B) Mean values of mitochondrial calcium loading capacity and PTP opening properties. Upper panel, maximal increase of Rhod-2 fluorescence (left panel) and time to the beginning of mitochondrial Ca2+ leak after Ca2+ addition (right panel). Lower panel, time to PTP opening after Ca2+ addition (left panel), and slope of calcein fluorescence decrease after PTP opening (right panel). *p<0.05; **p<0.01; ***p<0.001 versus Opa1+/+. (C) Time course of swelling (left) and depolarization (right) of isolated mitochondria after addition of 25 μM Ca2+.