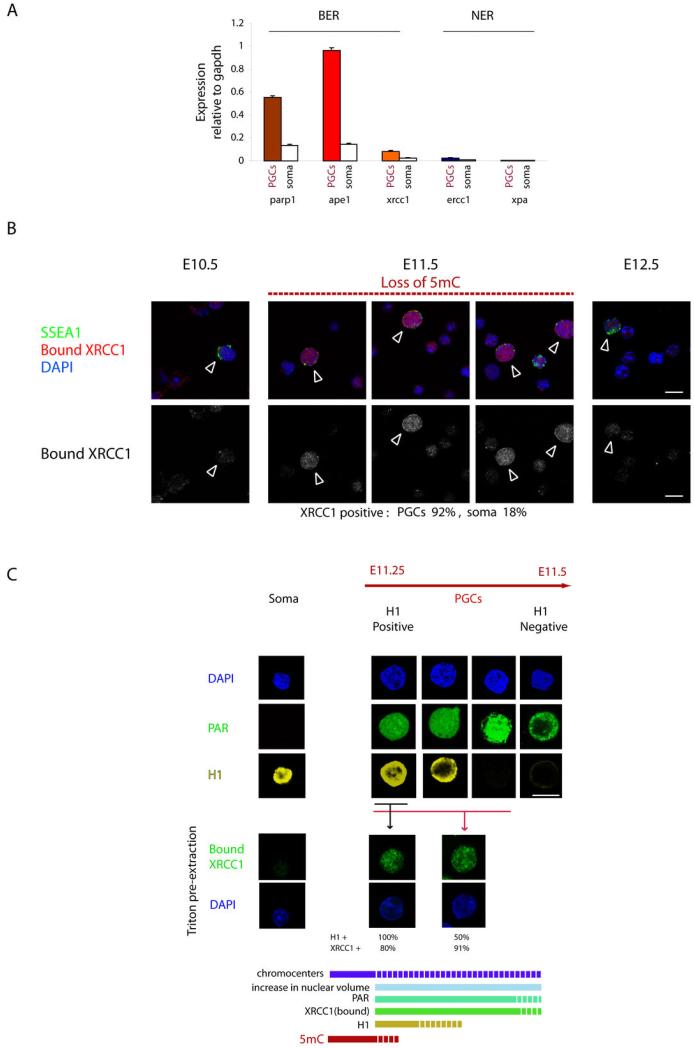
Figure 1. Activation of BER during DNA demethylation in gonadal PGCs.
a. qPCR analysis of PGC and neighbouring somatic cells at E11.5; note high expression of BER but not NER factors specifically in PGCs b. Chromatin bound XRCC1 detected by immunofluorescence in gonadal PGCs (arrowheads) at E11.5 at the time of DNA demethylation.. Single cell suspensions of embryonic genital ridges were pre-extracted with detergent prior to fixation (see Materials and Methods). c. Kinetics of BER activation with respect to chromatin changes in PGCs compared with neighbouring somatic cells at E11.25-E11.5 (Samples were prepared as described: see Supplementary Fig.1c). Immunofluorescence analysis of single cell suspension (upper panel), or after pre-extraction to detect chromatin bound XRCC1 (bottom panel). Note a transient subpopulation of H1 positive PGCs, which also display PAR and bound XRCC1 signals. There is than a progressive loss of H1 during between E11.25-E11.5, while the XRCC1 and of PAR signals persist in PGC population lacking H1. The kinetics of the process is depicted at the bottom with respect to the loss of 5mC. (Scale bar 10μM).

