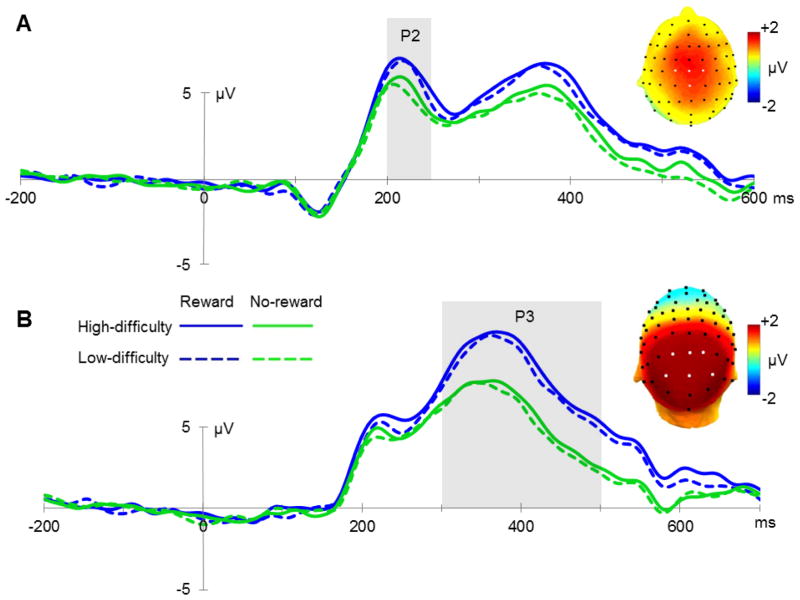
Figure 2.
Mid-range cue-related potentials. (A) Grand average ERPs elicited by cues in all four conditions at electrode sites C1, C2, Cz and CPz between 200 and 250 ms, and a topographic map reflecting the difference in P2 amplitude between reward-predicting cues and trials without reward prediction (electrodes of interest are indicated by white markers). (B) Grand average ERPs locked to the onset of the cue at electrode sites P1, P2, PO3, PO4, Pz and POz between 300 and 500 ms, reflecting P3 amplitudes in all conditions, and a topographic plot for reward condition versus no-reward condition.

