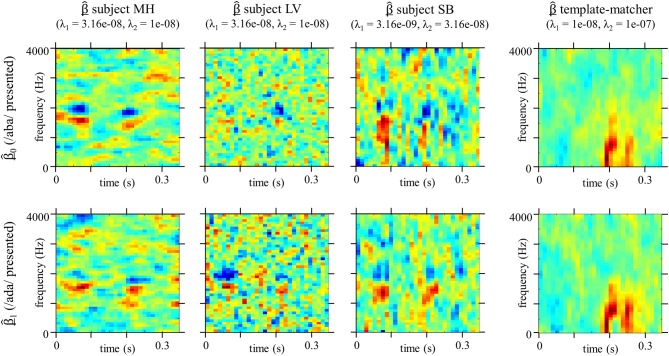
Figure 7.
Classification Images 0 and 1 estimated on the trials where t0 (/aba/) or t1 (/ada/) was presented respectively (n = 5000 trials for each estimate). Hyperparameters values are the same as for the “overall” Classification Images Figure 4. Weights are divided by their maximum absolute values.

