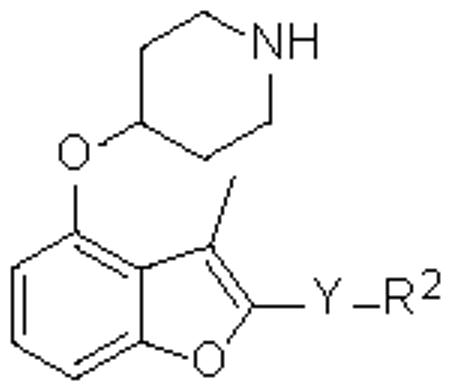
Table 1.
Activities of esters and amides against PfNMTa

| No. | Y | R2 | IC50 (μM) |
|---|---|---|---|
| 2 | COO | Et | 16.5 |
| 3 | COO | Ph | 24.4 |
| 4 | COOCH2 | Ph | 0.27 |
| 5 | COOCH2 | α-napthyl | 1.4 |
| 6 | COOCH2 | cyclo-hex | 9.7 |
| 7 | COO(CH2)2 | Ph | 4.1 |
| 8 | COO(CH2)3 | Ph | 36.2 |
| 9 | CONH | i-Pr | >200 |
| 10 | CONH | cyclo-hex | >100 |
| 11 | CONH | Ph | 28.8 |
| 12 | CONHCH2 | Ph | 13.0 |
| 13 | CONHCH2 | α-napthyl | 2.3 |
The IC50(PfNMT) values were averaged from two independent dose-response curves, the standard deviation was within 30% of the resulting values.
