
Fig. 2.
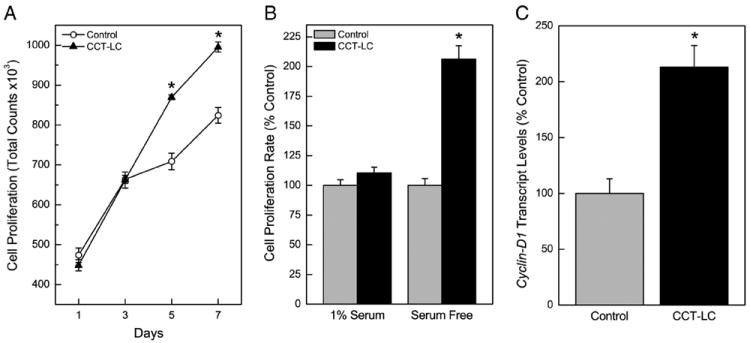
Cell proliferation and cyclin D1 expression in CCT-LC or control cells. (A) Cell proliferation over seven days. (B) Cell proliferation in serum free media. (C) Relative expression of Cyclin D1 transcript. Data represent the mean ± SEM (n = 3). Treated data were compared in all cases with passage-matched controls. A p ≤0.05 was considered significant. An asterisk (*) indicates significance from control.