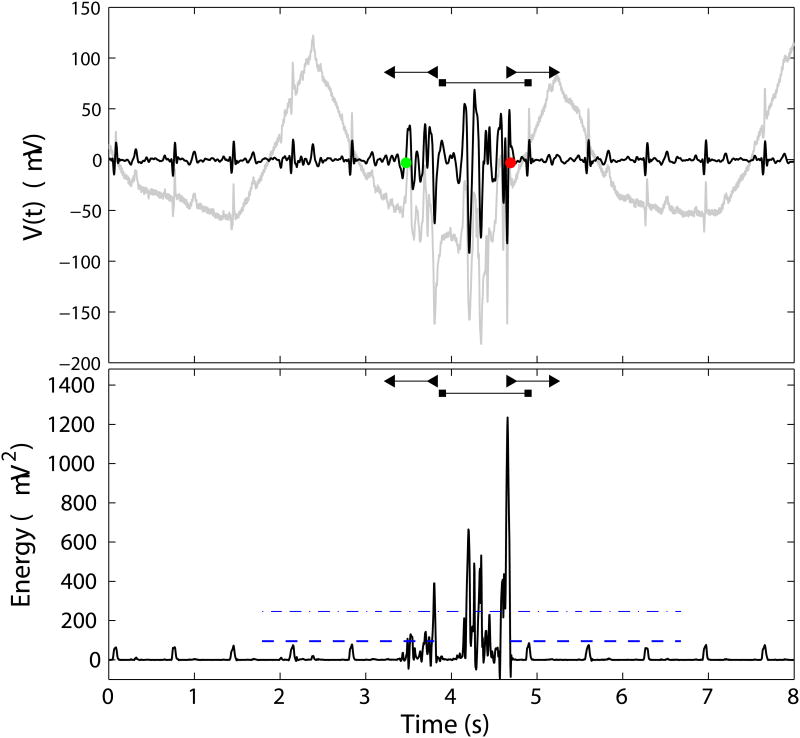
Figure 1.
Top: Representative raw electrode signal (gray trace) and SALPA + SG filtered signal (black trace). Bottom: Energy signal. The dash-dotted line marks the energy detection threshold. The window in which SVM features are computed is demarcated by the horizontal line terminating in squares. The lower threshold is indicated by the dotted line, and the horizontal bars terminating in left and right triangles demarcate the on and off time search windows, respectively. A spike burst occurs from ≈ 3.4 - 4.7 s. Regular cardiac artifacts are seen in the signals at approximately 0.75 s intervals.

