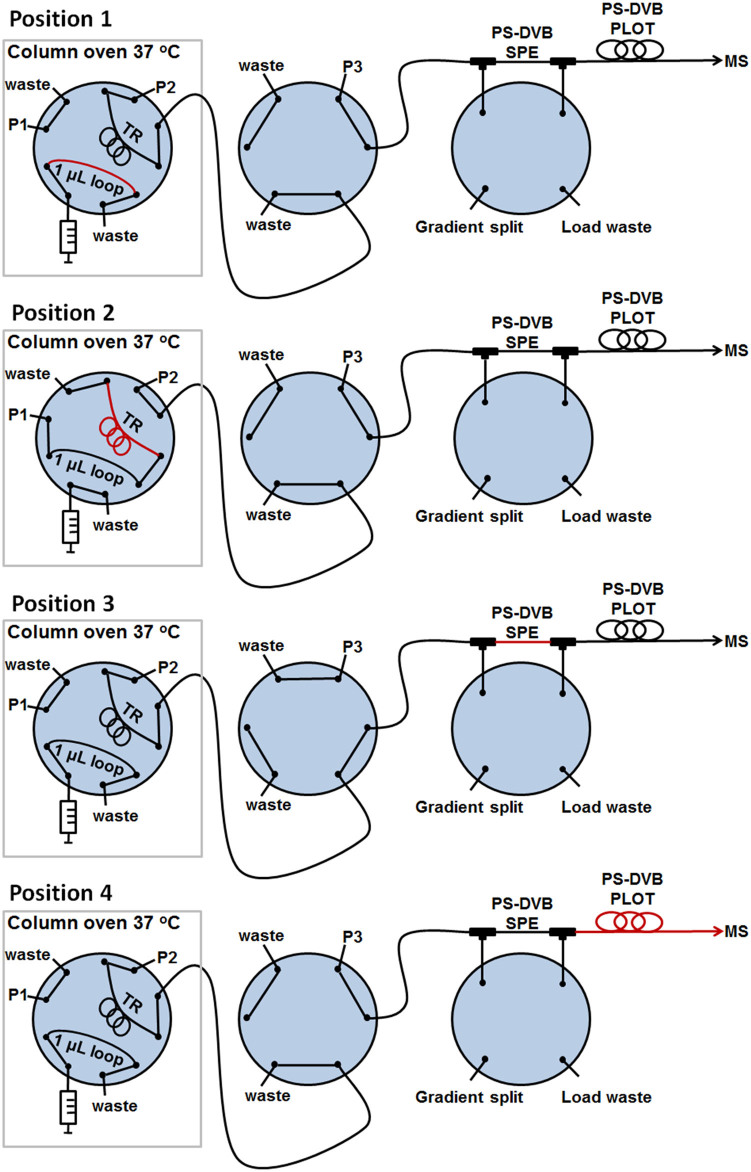
Figure 2. Experimental set-up of the nanoproteomic platform.
Position 1: Sample injection. Position 2: Loading and subsequent digestion on trypsin reactor (TR). Position 3: SPE trapping. Position 4: PLOT LC separation with 40 nL/min flow. Washing and reconditioning of trypsin reactor. The red line represents the sample. See also the method section and animation (http://prezi.com/zxp2ioe_ecp2/lc-system/#) in the online version for more details.

