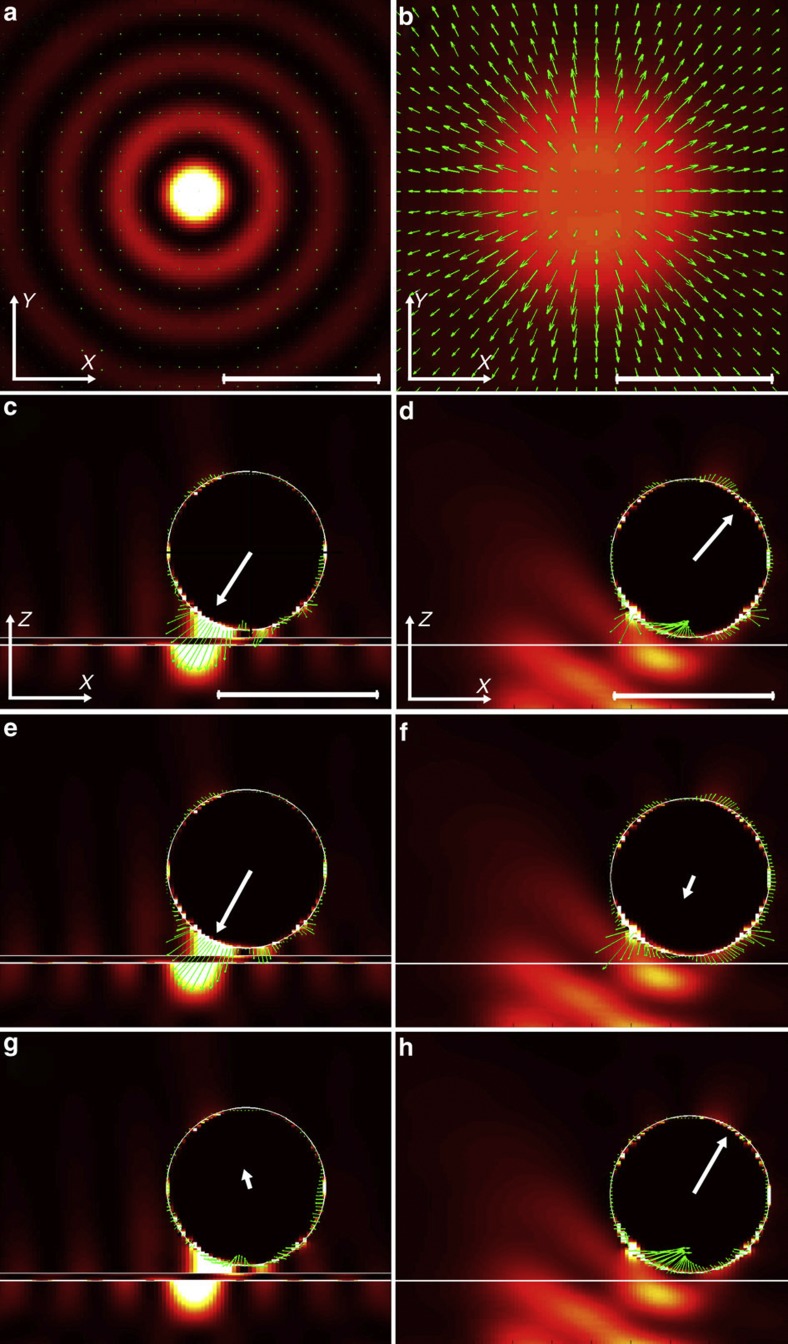
Figure 3. Comparison of forces in plasmonic and optical tweezers.
Distribution of electric field intensity (background) and Poynting vector (green arrows) in the horizontal x-y plane of (a) the focused plasmonic tweezers and (b) the focused optical tweezers, where the x-y plane is 50 nm above the gold–water interface in (a) and the glass–water interface in (b), respectively. (c), (e) and (g) show the total force, gradient force and scattering force, respectively (green arrows), distributed on a gold particle (diameter of 1 μm) in the vertical x-z plane for the plasmonic tweezers. The background is the electric field intensity, while the white lines indicate the spherical particle and gold film. The particle with a diameter of 1 μm is 50 nm above the gold surface and 300 nm away from the SPP peak at the horizontal centre. (d), (f) and (h) show similar cases to (c), (e) and (g), respectively, except for the optical tweezers without metal film and the particle is 600 nm away from the horizontal centre. The white arrow starting from the centre of the sphere in (c–h) denotes the resultant force on the particle. The length of all scale bars (white line in lower right corner) is 1 μm. Other simulation parameters are as follows: the incident wavelength is λ0=1,064 nm, the thickness of the gold film is 45 nm, the refractive index of the glass substrate is 1.515.

