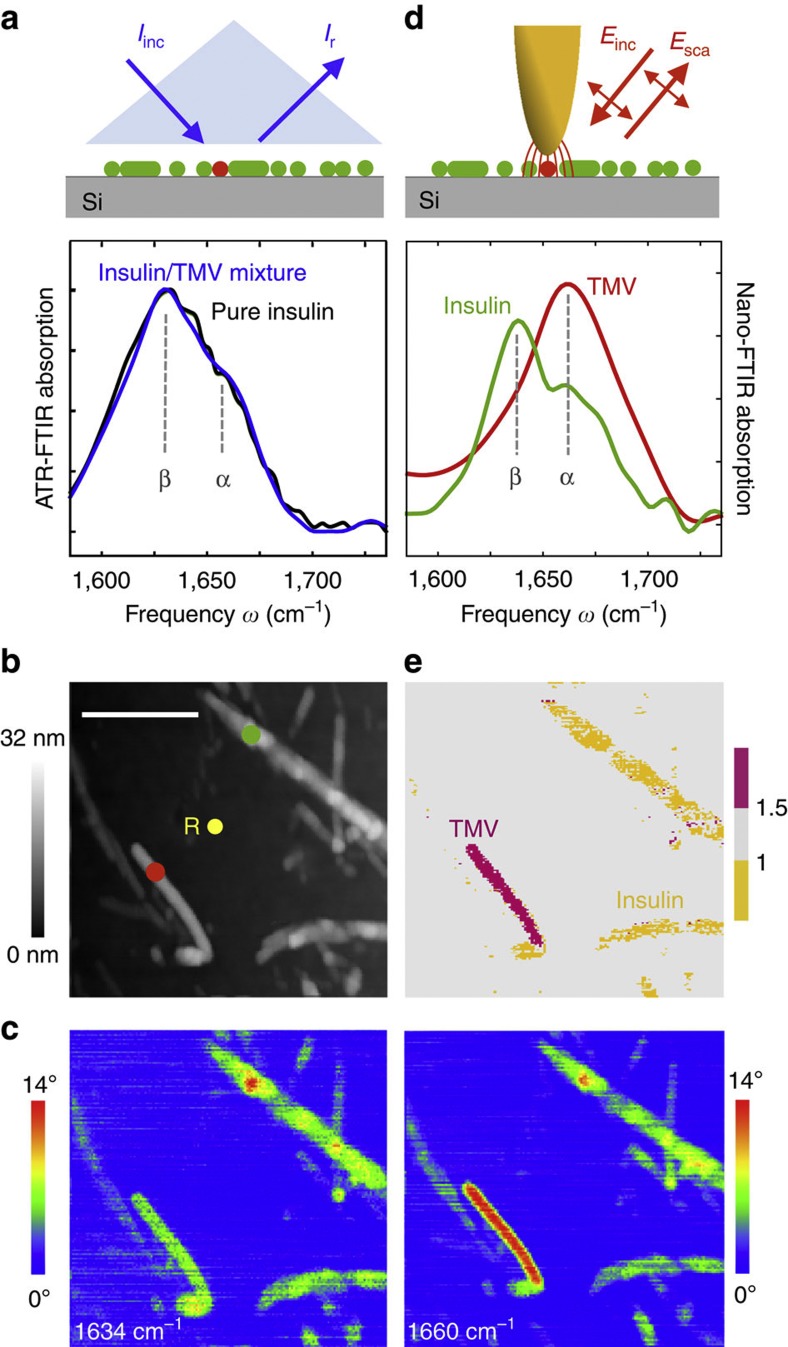
Figure 5. Nanoscale mapping of α-helical and β-sheet secondary structure.
(a) ATR-FTIR spectrum of a pure insulin aggregate sample (black) and a mixture of insulin aggregates and TMV (blue) on a silicon support. (b) Topography of a mixture of TMV and insulin aggregates on silicon. Scale bar, 500 nm. (c) Infrared near-field phase images ϕ3 at two different frequencies, 1,634 cm−1 (left) and 1,660 cm−1 (right; 19 min total image acquisition time). (d) Nano-FTIR spectra of TMV (red, average of 70 interferograms; 19 min total acquisition time; 16 cm−1 resolution; × 4 zero filling) and insulin aggregate (green, average of 40 interferograms; 22 min total acquisition time; 8 cm−1 resolution × 4 zero filling). Red and green dots in the topography image mark the positions where the nano-FTIR spectra were taken. The position marked by the yellow dot and R indicates where the reference spectrum was recorded. (e) Map of TMV (purple) and insulin (yellow) aggregates.

