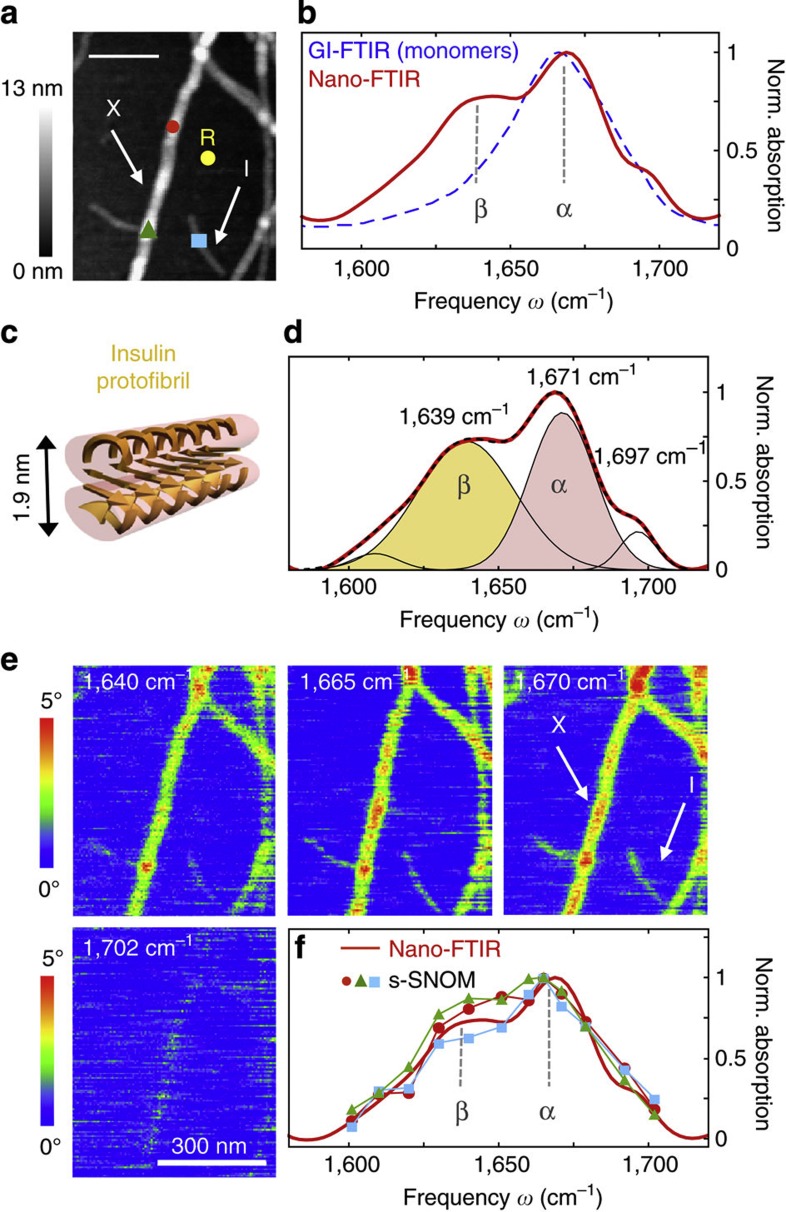
Figure 6. Infrared nanospectroscopy and nanoimaging of secondary structure in individual insulin fibrils.
(a) Topography of insulin fibrils on a silicon substrate. Scale bar, 200 nm. The arrows indicate a type I fibril (I) and a 9-nm-thick fibril composed of several protofilaments (X), respectively. (b) Nano-FTIR spectrum of a 9-nm-thick insulin fibril (red, average of 154 interferograms; 8 cm−1 resolution; × 4 zero filling) recorded at the position marked by the red symbol in a. The position marked by the yellow dot and R indicates where the reference spectrum was recorded. The dashed blue line shows for comparison a GI-FTIR spectrum of insulin monomers on a gold substrate. (c) Illustration of the structure of an amyloid-like insulin protofibril (a type I fibril consists of two protofibrils). (d) Band decomposition of the nano-FTIR spectrum (red curve) based on five absorption bands (thin black curves). The dashed black curve shows the resulting fit. (e) s-SNOM phase images of the fibrils shown in a. Scale bar, 300 nm. (f) Local infrared absorption spectra (symbols) depicting the normalized imaginary part of the near-field signal at the positions marked in a. The data points were extracted from 12 near-field amplitude and phase images and were normalized to the imaginary part of the near-field signal on the silicon substrate. Four of the phase images are shown in e. For comparison, the nano-FTIR spectrum of b is depicted by the red thick curve. All spectra are normalized to their maximum value.

