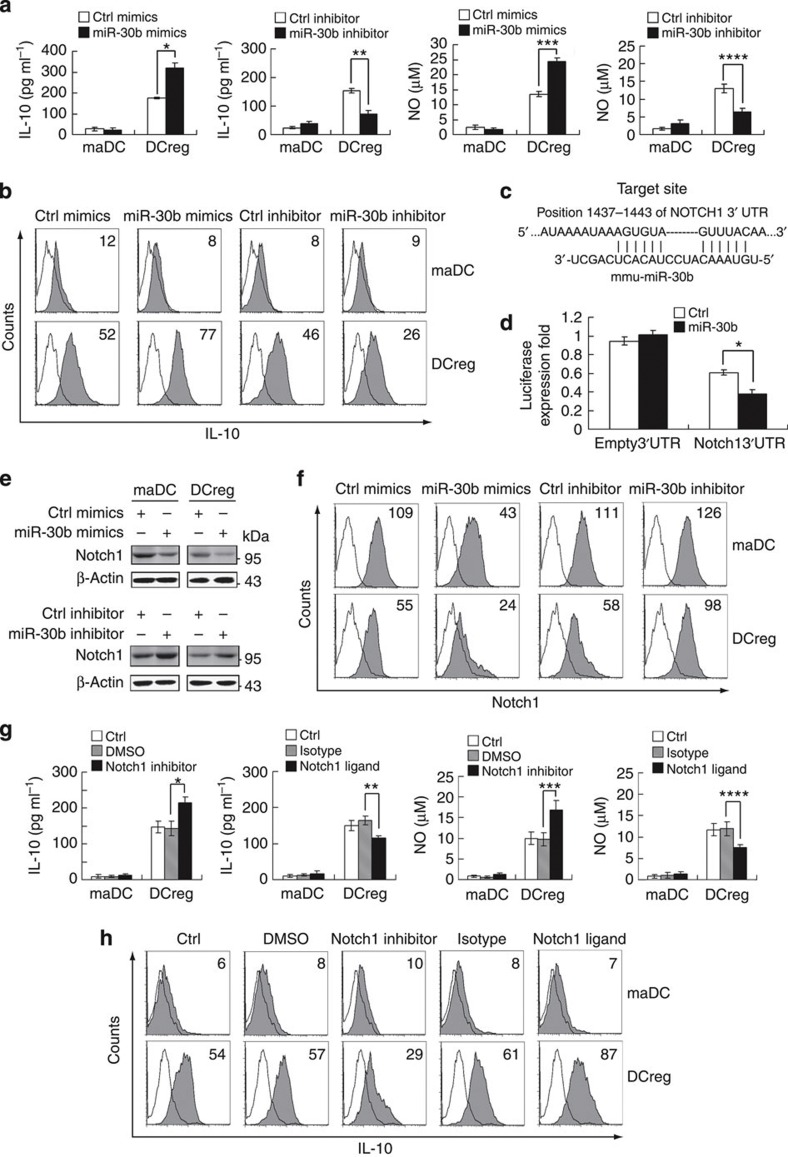
Figure 6. miR-30b promotes preferential IL-10 and NO production in DCreg through targeting Notch1.
(a) maDCs and DCreg (5 × 10⁵ per ml) were transfected with control mimics or miR-30b mimics, control inhibitor or miR-30b inhibitor as indicated. After 48 h, IL-10 (left) and NO (right) in supernatants was measured by ELISA and Griess assay, respectively. Data are shown as means ±s.d. (n=3). Similar results were obtained in three independent experiments. *P=0.0005, **P=0.0007, ***P=0.0004, ****P=0.0034 (two-tailed Student’s t-test). (b) Flow cytometry analysis of intracellular staining for IL-10 expression of DCs transfected as in (a). Numbers in the histograms indicate the geometric mean fluorescence of the test samples. Similar results were obtained in at least three independent experiments. (c) Mouse Notch1 might be molecular target of miR-30b. Shown is a sequence alignment of miR-30b and its target sites in 3′UTR of Notch1, which was downloaded from TargetScan ( http://www.targetscan.org). (d) HEK293 cells (1 × 10⁴) were co-transfected with pGL3 firefly luciferase reporter plasmids or pGL3-Notch1 3′UTR firefly luciferase reporter plasmids, pTK–Renilla-luciferase plasmids, together with ctrl mimics or miR-30b mimics as indicated. After 24 h, firefly luciferase activity was measured and normalized by Renilla luciferase activity. Data are shown as means ±s.d. (n=3). Similar results were obtained in three independent experiments. *P=0.0033 (two-tailed Student’s t-test). (e) maDCs and DCreg (1 × 10⁶) were transfected as described in (a). After 48 h, Notch1 and β-actin were detected. (f) maDCs and DCreg were transfected with miR-30b mimics or miR-30b inhibitor as in (e). The surface expression of Notch1 expression was detected by flow cytometry. Numbers in the histograms indicate the geometric mean fluorescence of the test samples. (g) Cells were treated with mouse Delta 4 (0.5 μg ml−1) or γ-SiX (10 μM) for 18 h. IL-10 (left) and NO (right) in supernatants were measured by ELISA and Griess assay, respectively. Data are shown as means±s.d. (n=3). Similar results were obtained in three independent experiments. *P=0.0095, **P=0.0031, ***P=0.0125, ****P=0.0132 (two-tailed Student’s t-test). (h) maDCs and DCreg were treated as in (g) as indicated. Expression of IL-10 was detected by intracellular staining. Numbers in the histograms indicate the geometric mean fluorescence of the test samples. Similar results were obtained in at least three independent experiments.

