
Figure 3.
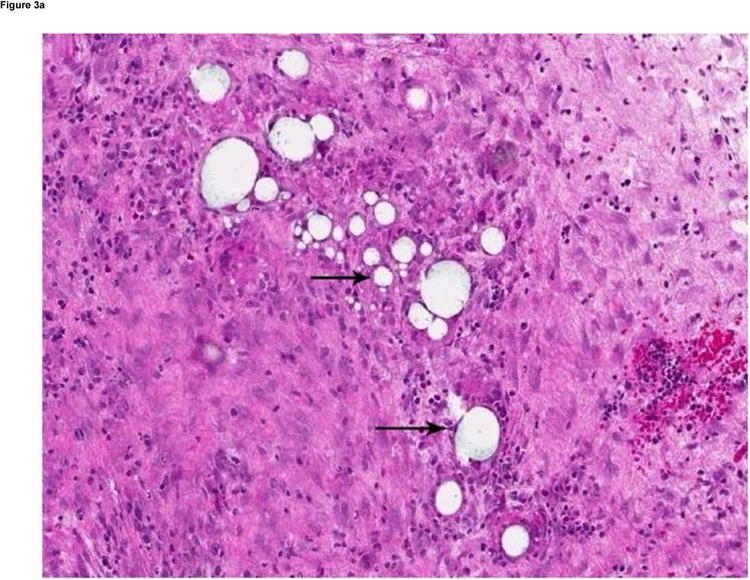
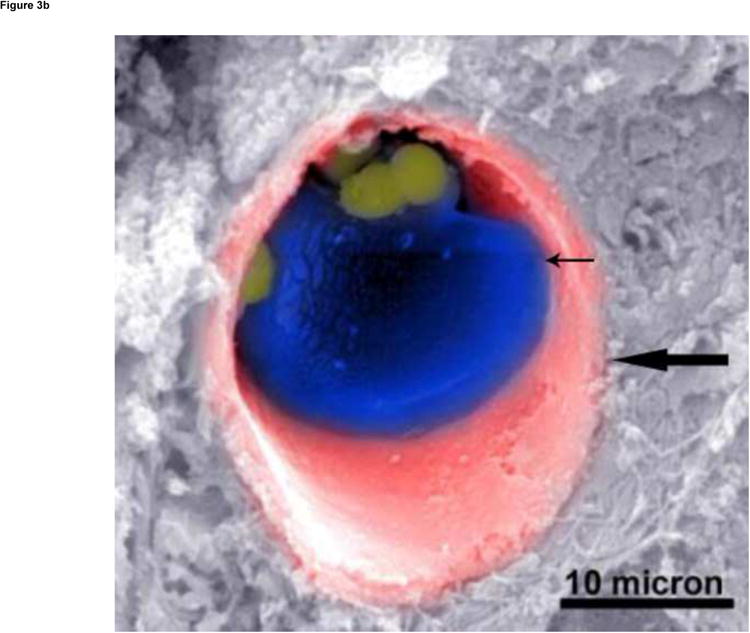
(a) Hematoxylin and eosin–stained slide (180× magnification). MS are visualized as white spheres (black arrows) under light microscopy. (b) A scanning electron micrograph (3000× magnification) of a VX2 tumor shows the presence of MS (small arrow) in a tumor blood vessel (large arrow).