
Figure 4.
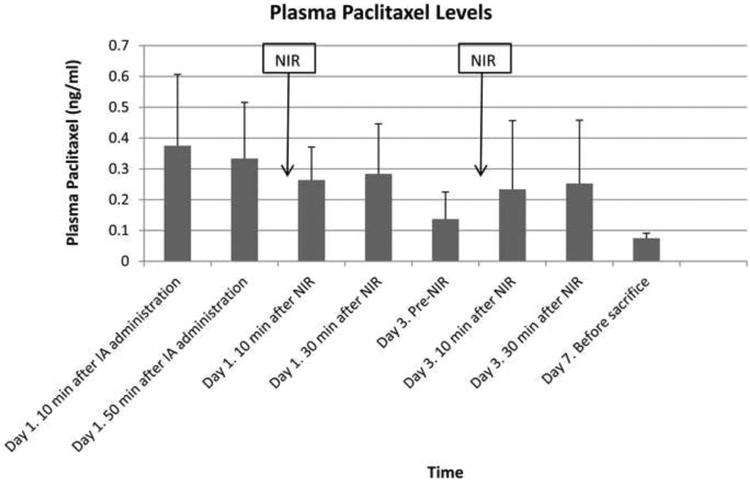
Bar chart showing mean plasma PTX levels with 1 standard deviation error bars at different time points after IA administration of MS-HAuNS-PTX. The blood concentration of PTX was analyzed by using high-performance liquid chromatography.
Official websites use .gov
A
.gov website belongs to an official
government organization in the United States.
Secure .gov websites use HTTPS
A lock (
) or https:// means you've safely
connected to the .gov website. Share sensitive
information only on official, secure websites.
Bar chart showing mean plasma PTX levels with 1 standard deviation error bars at different time points after IA administration of MS-HAuNS-PTX. The blood concentration of PTX was analyzed by using high-performance liquid chromatography.