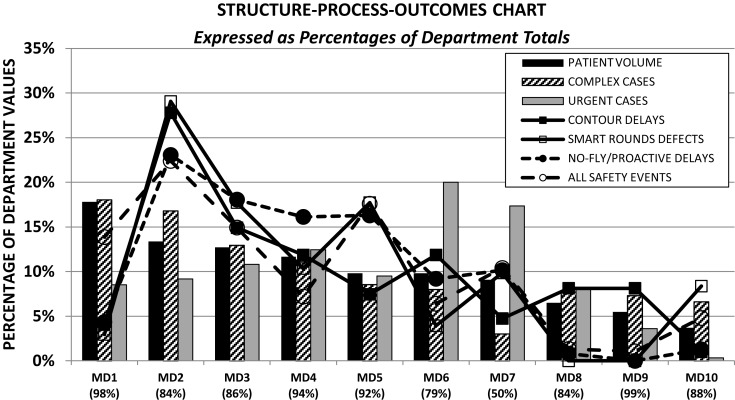
Figure 6.
Variability amongst radiation oncologists in process execution and patients effects in the framework of department caseload distributions. All percentages are quoted based on department totals for each category. Numbers quoted near the MD designations correspond to the fraction of patients seen by each MD at their prominent practice site amongst the four sites of the department.

