
Figure 3.
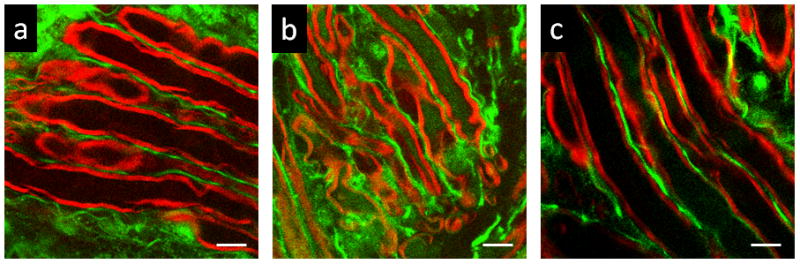
CARS/TPEF imaging reveals calcium influx into myelinated axons (red: CARS, green: TPEF). TPEF images of Oregon Green 488 (green) and CARS images of myelin (red) show intraaxonal free Ca2+ levels in compression-injured (b), healthy (a), and micelle-treated (c) spinal cords. Images were acquired 1 h after compression injury. 0.67 mg/ml micelles were added immediately after compression injury. Scalar bars = 10 μm. Images adapted from reference [122].