Figure 4.

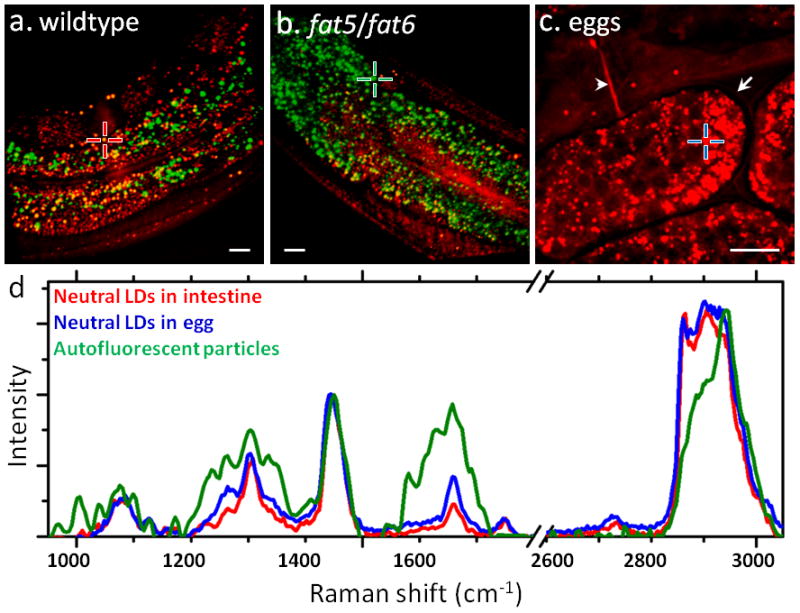
CARS/TPEF imaging and confocal Raman spectral analysis of lipids in C. elegans (red: CARS, green: TPEF). (a–b) Overlaid CARS and TPEF images of neutral lipids (red) and autofluorescent particles (green) in a wildtype (a) and a fat-5/fat-6 double mutant (b) C. elegans. The fat-5/fat-6 double mutant has genetic deletions of palmitoyl-CoA desaturase fat-5 and stearoyl-CoA desaturases fat-6. (c) CARS image of eggs laid outside of an adult C. elegans. Arrow: eggshell. Arrowhead: vulva. (d) Overlaid Raman spectra of neutral LDs in intestine (red line, corresponding to the red cross in a), neutral LDs in eggs (blue line, corresponding to the blue cross in c), and autofluorescent particles (green line, corresponding to the green cross in b). Scalar bars = 10 μm. Images in a–b are adapted from reference [109].
