
Figure 8.
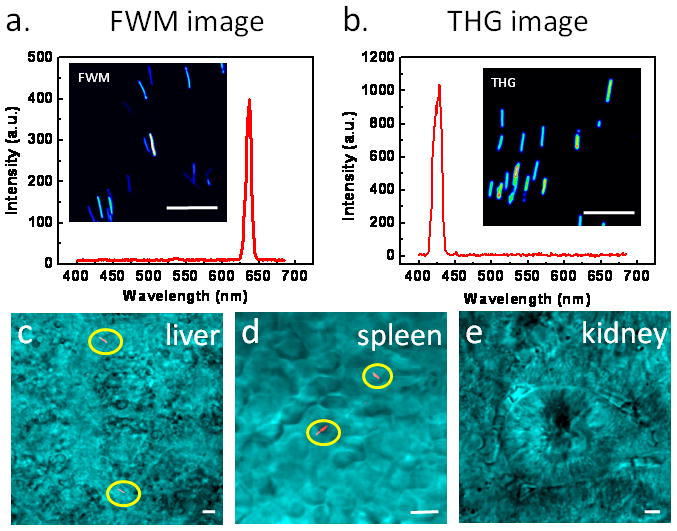
SiNW as a NLO imaging agent. (a) FWM image and spectrum of SiNWs. The pump (790 nm) and Stokes (1018 nm) laser power at the sample were 0.8 and 1.2 mW, respectively. (b) THG image and spectrum of SiNWs. The 1290 nm laser power at the sample was 8.6 mW. (c–e) FWM images of SiNWs (red) deposited in liver (c), spleen (d), and kidney (e) explanted at 1 h post injection. FWM images in c–e are superimposed with transmission images (cyan) taken simultaneously. The SiNWs were highlighted by yellow circles. Scale bars = 5 μm. Images adapted from reference [52].