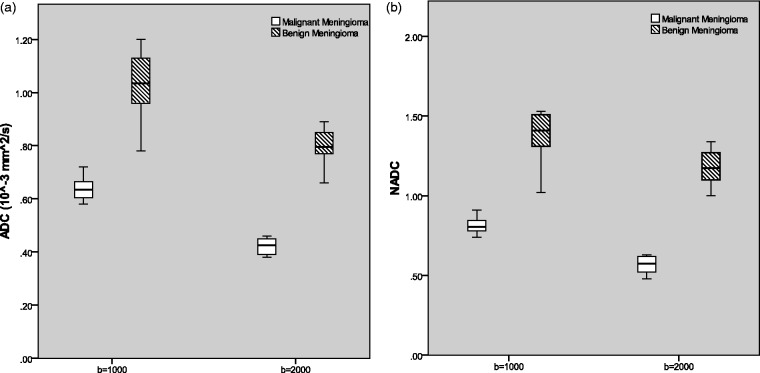
Fig. 2.
Box and whisker plot showing a comparison of ADC values between benign and malignant type at both the b-values. (a) Absolute ADC values of tumorous tissues in benign and malignant meningiomas showing some overlap between two types. (b) Comparison of NADC ratios between benign and malignant meningiomas at b = 1000 and 2000 s/mm2. The horizontal line is the median, vertical lines represent data ranges; two halves of the rectangular boxes represent the upper and lower quartiles.

