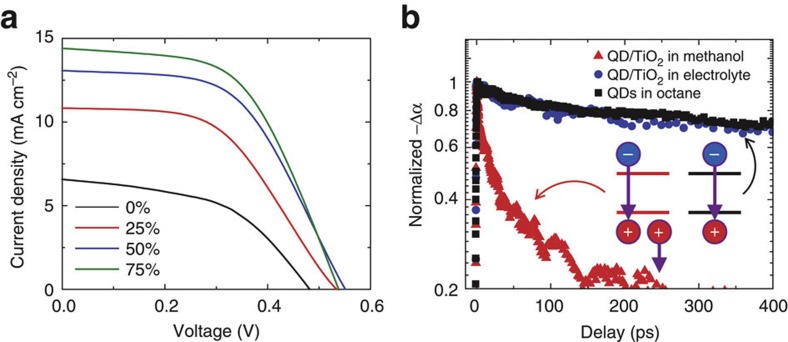
Figure 5. Dependence of device performance on the electrolyte composition.
(a) Current density versus voltage characteristics under simulated sunlight for QDSSCs with varying amounts of methanol in the electrolyte (reducing the polysulfide concentration by dilution). A ZnS SILAR coating was not used. A table of the photovoltaic performance properties can be found in Supplementary Table S6. (b) QD population decay monitored by probing the temporal evolution of the band-edge bleach with transient absorption. The traces in the figure correspond to isolated QDs dispersed in octane (black square), and QDs attached to the TiO2 matrix exposed to either methanol (red triangle) or electrolyte (blue circle).

